Tag: Cascade

Our Perspective on Brookings’ AVM Whitepaper

As the publisher of the AVMNews, we felt compelled to respond to the Brookings’ very thorough whitepaper on AVMs (Automated Valuation Models) published on October 12, 2023, and share our thoughts on the recommendations and insights presented therein.

First and foremost, I would like to acknowledge the thoroughness and dedication with which Brookings conducted their research. Their whitepaper contains valuable observations, clear explanations and wise recommendations that unsurprisingly align with our own perspective on AVMs.

Here’s our stance on key points from Brookings’ whitepaper:

  1. Expanding Public Transparency: We wholeheartedly support increased transparency in the AVM industry. In fact, Lee’s recent service on the TAF IAC AVM Task Force led to a report recommending greater transparency measures. Transparency not only fosters trust but also enhances the overall reliability of AVMs.
  2. Disclosing More Information to Affected Individuals: We are strong advocates for disclosing AVM accuracy and precision measures to the public. Lee’s second Task Force report also recommended the implementation of a universal AVM confidence score. This kind of information empowers individuals with a clearer understanding of AVM results.
  3. Guaranteeing Evaluations Are Independent: Ensuring the independence of evaluations is paramount. Compliance with this existing requirement should be non-negotiable, and we fully support this recommendation.
  4. Encouraging the Search for Less Discriminatory AVMs: Promoting the development and use of less discriminatory AVMs aligns with our goals. We view this as a straightforward step toward fairer AVM practices.

Regarding Brookings’ additional points 5, 6, and 7, we find them to be aspirational but not necessarily practical in the current landscape. In the case of #6, regulating Zillow, it appears that existing and proposed regulations adequately cover entities like Zillow, provided they use AVMs in lending.

While we appreciate the depth of Brookings’ research, we would like to address a few misconceptions within their paper:

  1. Lender Grade vs. Platform AVMs: We firmly believe that there is a distinction between lender-grade and platform AVMs, as evidenced by our testing and assessments. Variations exist not only between AVM providers but also within the different levels of AVMs offered by a single provider.
  2. “AVM Evaluators… Are Not Demonstrably Informing the Public:” We take exception to this statement. We actively contribute to public knowledge through articles, analyses, newsletters (AVMNews and our State of AVMs), quarterly GIF, a comprehensive Glossary, and participation in industry groups, task forces. We also serve the public by making AVM education available, and we would have been more than willing to collaborate or consult with Brookings during their research.

But, we’re obligated not to just give away our analysis or publish it. Our partners in the industry provide us their value estimates and we provide our analysis back to them. It’s a major way in which they improve, because they’re able to see 1) an independent test of accuracy, and 2) a comparison to other AVMs. They can see where they’re being beaten, which means opportunity for improvement. But, in order to participate, they require some confidentiality to protect their IP and reputation.

We should comment on the concept of independence that Brookings emphasized. Independent evaluation is exceedingly important in our opinion, as the only independent AVM evaluator. Brookings mentioned in passing that Mercury is not independent, but they also mentioned Fitch as an independent evaluator. We agree with Brookings that a vendor who also sells, builds, resells, uses or advocates for certain AVMs may be biased (or may appear to be biased) in auditing them; validation must be able to “effectively challenge” the models being tested.

We do not believe Fitch satisfies ongoing independent testing, validation and documentation of testing which requires resources with the competencies and influences to effectively challenge AVM models. Current guidelines require validation to be performed in real-world conditions, to be ongoing, and to be reported on at least annually.  When there are changes to the models, the business environment or the marketplace, the models need to be re-validated.

Fitch’s assessment of AVM providers is focused on each vendor’s model testing results, review of management and staff experience, data sourcing, technology effectiveness and quality control procedures. Fitch’s methodology of relying on analyses obtained from the AVM providers’ model testing results would not categorize them as an “independent AVM evaluator,” as reliance on testing done by the AVM providers themselves does not meet any definition of “independent” per existing regulatory guidance. AVMetrics is in no way beholden to the AVM developers or the resellers in any way; we draw no income from selling, developing, or using AVM products.

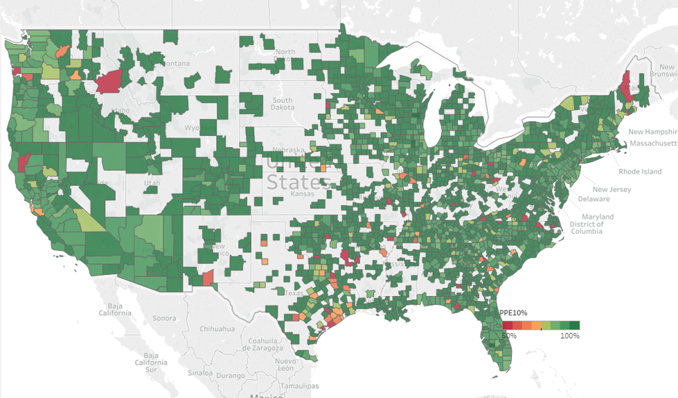
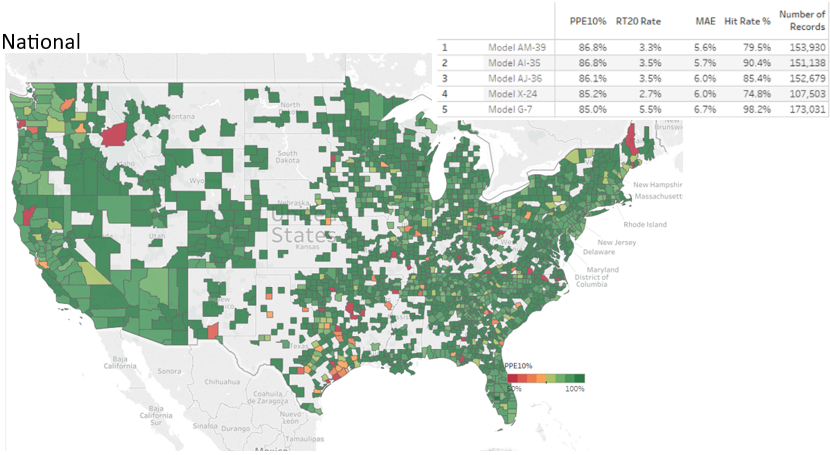
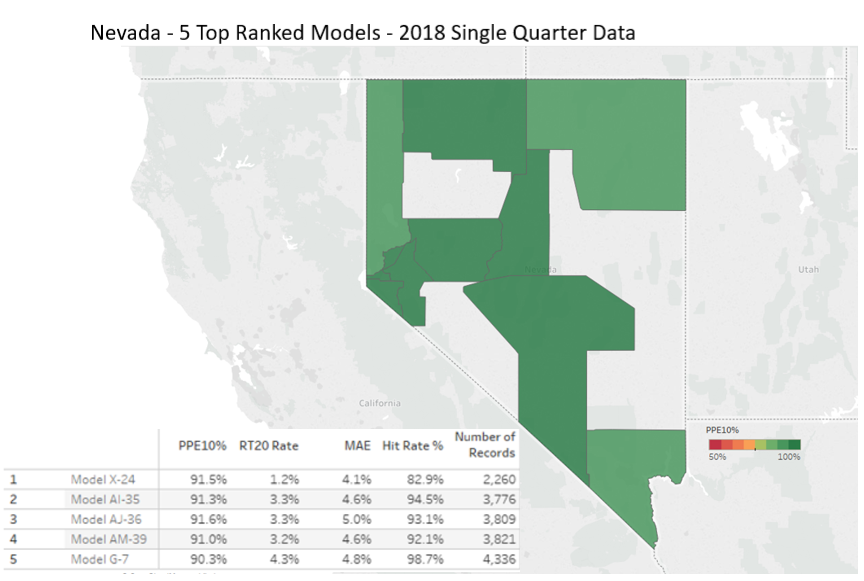
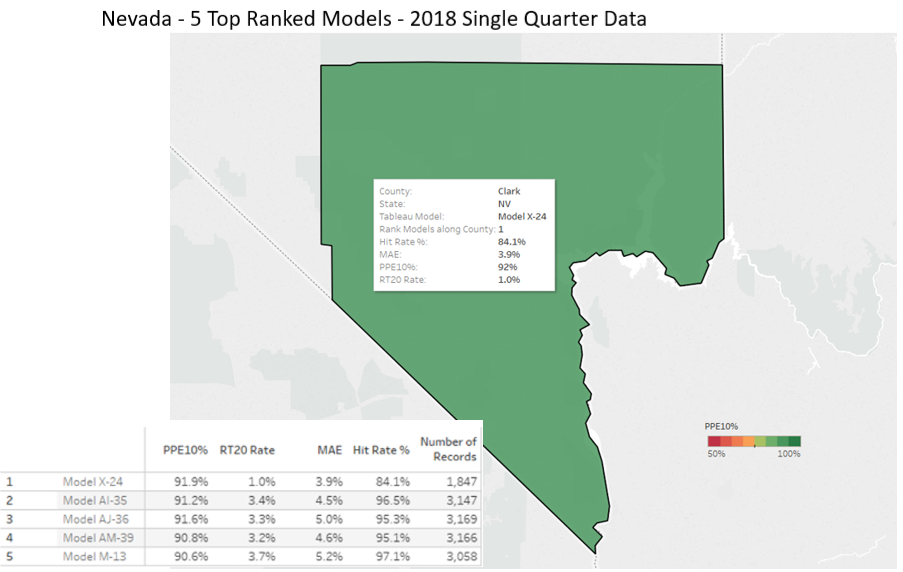
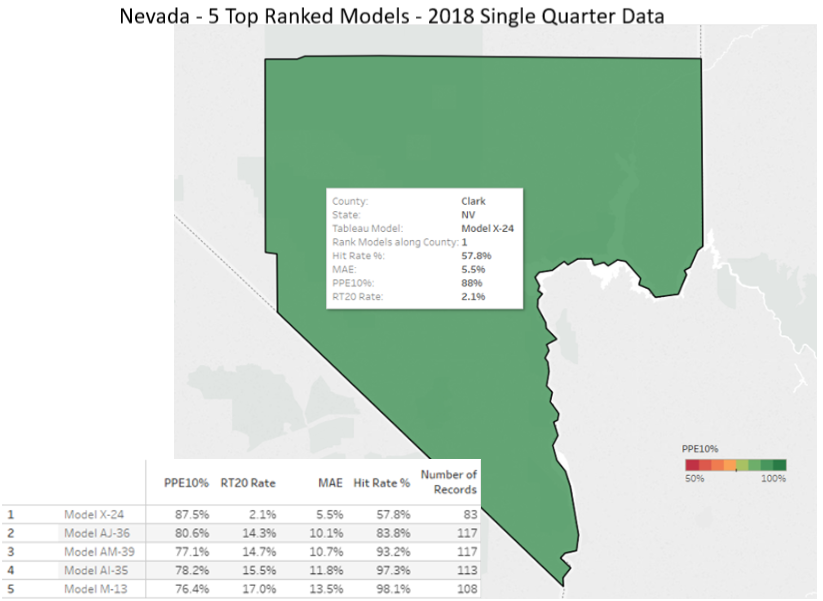
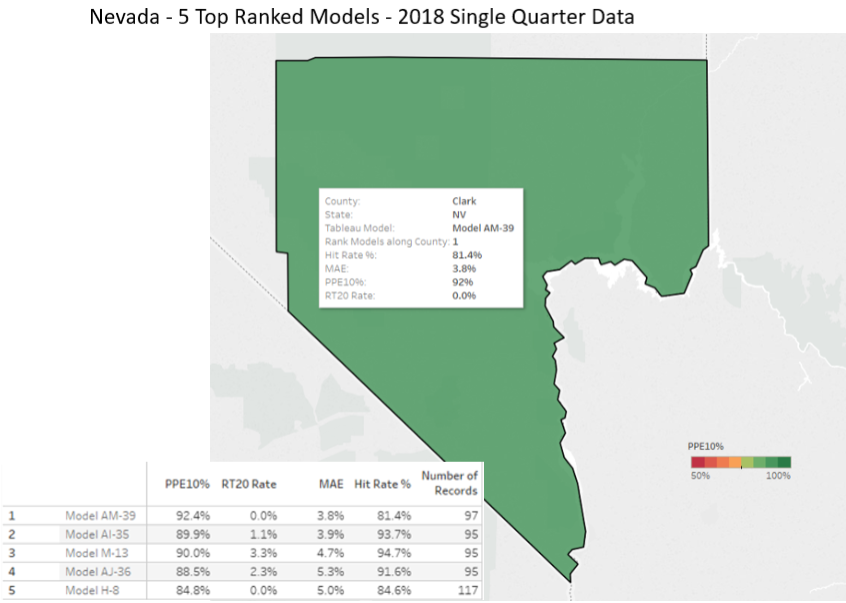
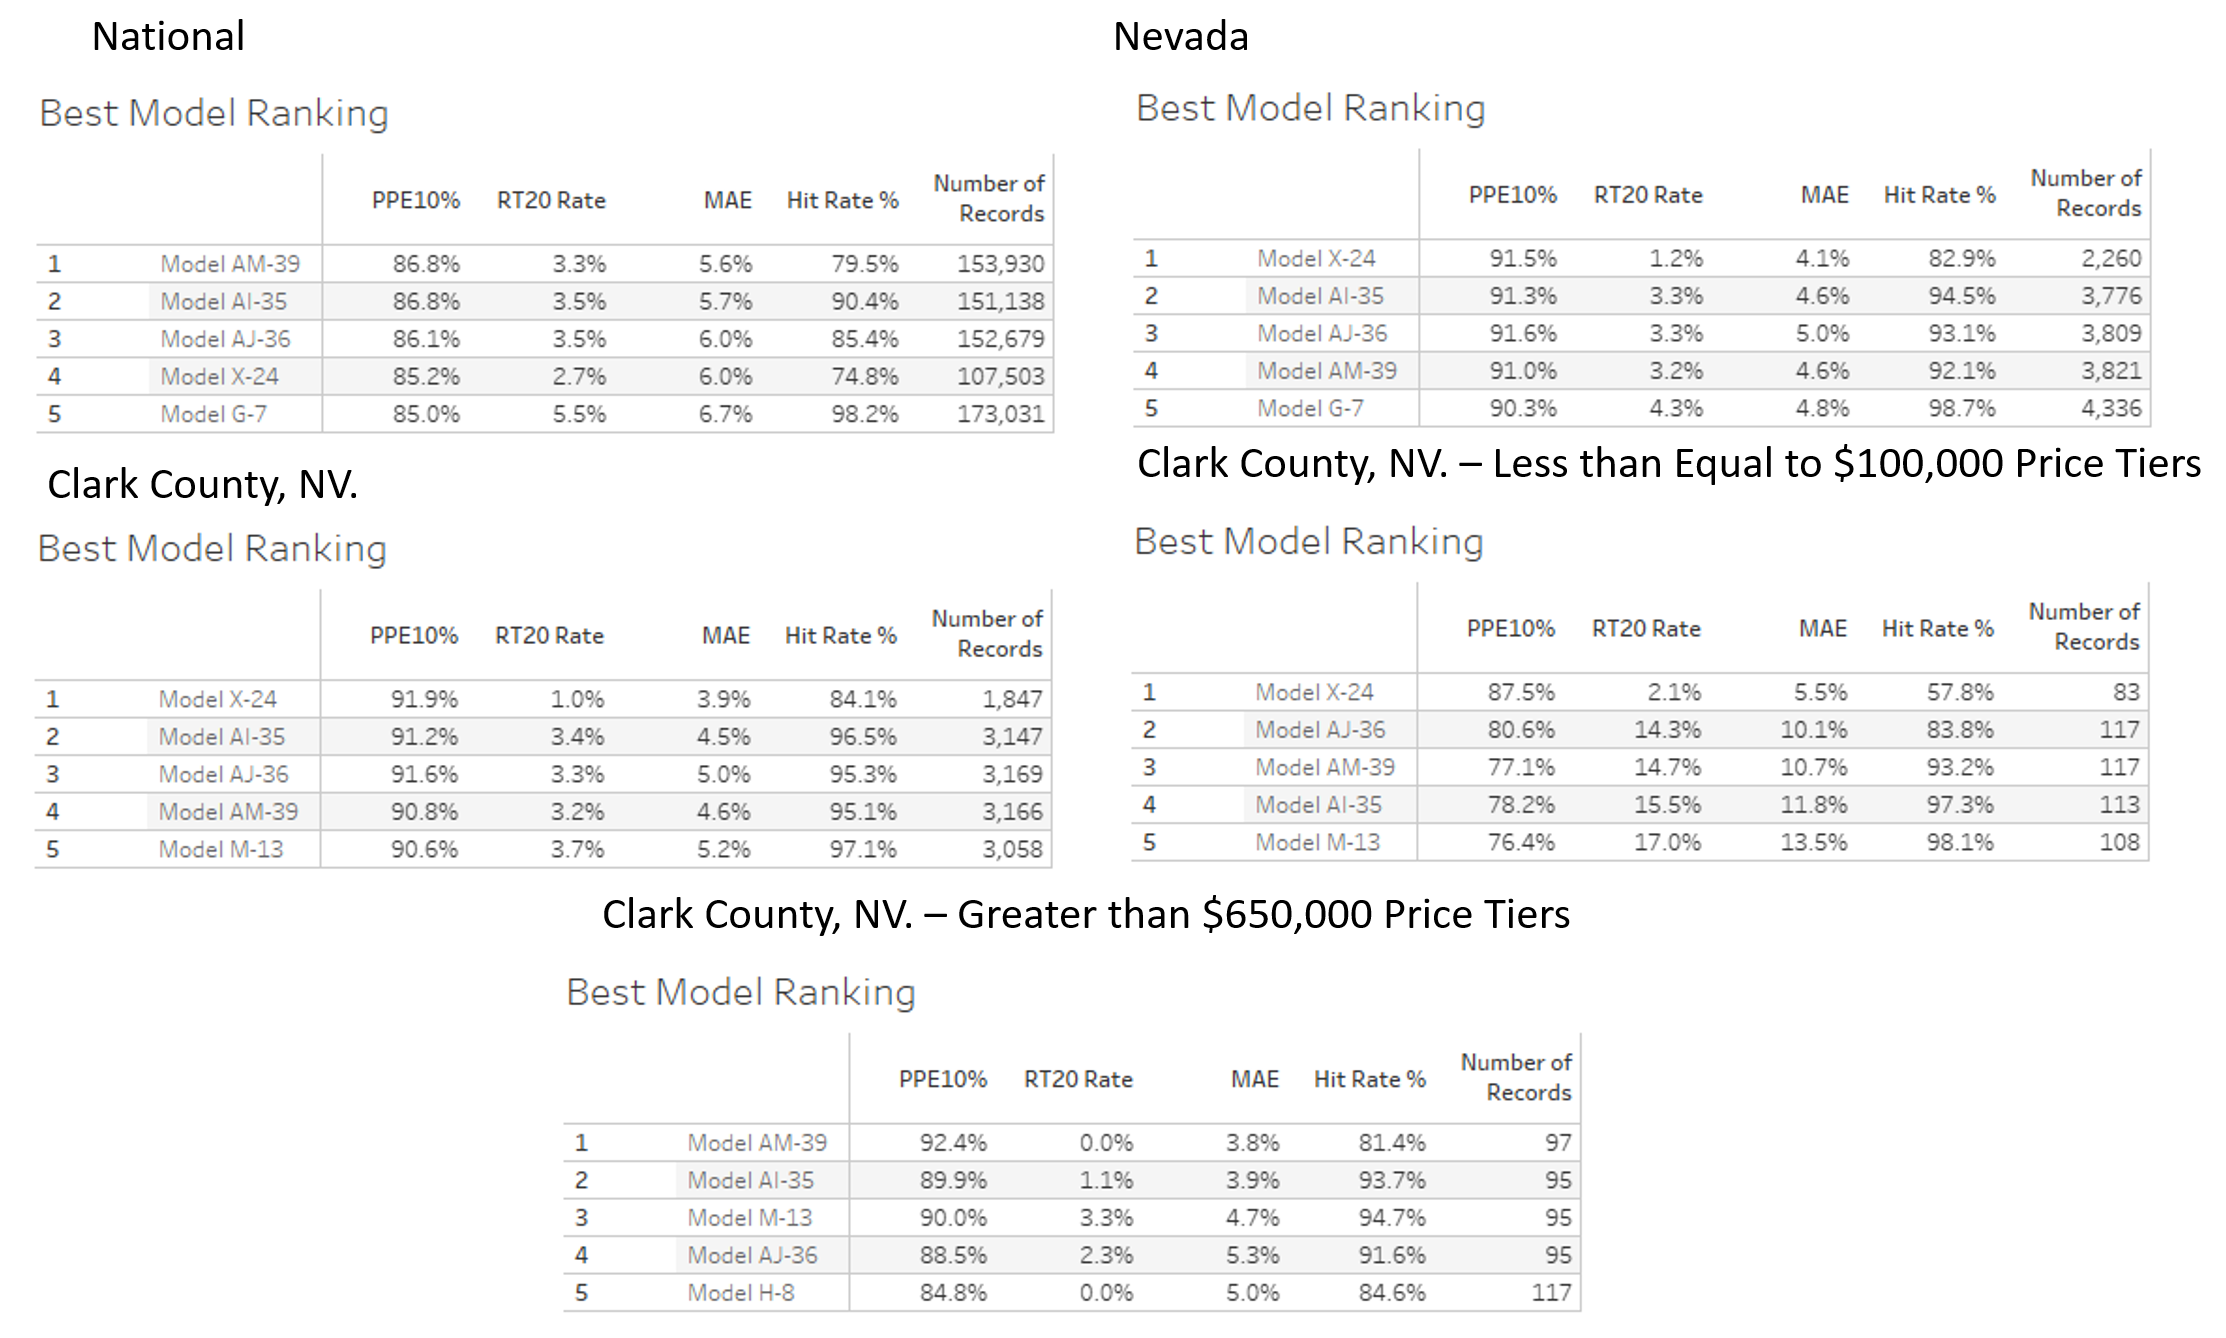
For almost two decades, we have continued to test AVMs against hundreds of thousands (sometimes millions) of transactions per quarter and use a variety of techniques to level the playing field between AVMs. We provide detailed and transparent statistical summaries and insights to our newsletter readers, and we publish charts that give insights into the depth and thoroughness of our analysis, whereas we have not observed this from other testing entities. Our research spanning eighteen years shows that even overall good-preforming models are less reliable in certain circumstances, so one of the less obvious risks that we would highlight is reliance on a “good” model that is poor in a specific geography, price level or property type. Models should be tested in each one of these subcategories in order to assess their reliability and risk profile. Identifying “reliable models” isn’t straightforward. Performance varies over time as market conditions change and models are tweaked. Performance also varies between locations, so a model that is extremely reliable overall may not be effective in a specific region. Furthermore, models that are effective overall may not be effective at all price levels, for example: low-priced entry-level homes or high-priced homes. Finally, very effective models will also produce estimates that they admit have lower confidence scores (and higher FSDs), and which should in all prudence be avoided, but without adequate testing and understanding may be inadvertently relied upon. Proper testing and controls can mitigate these problems.

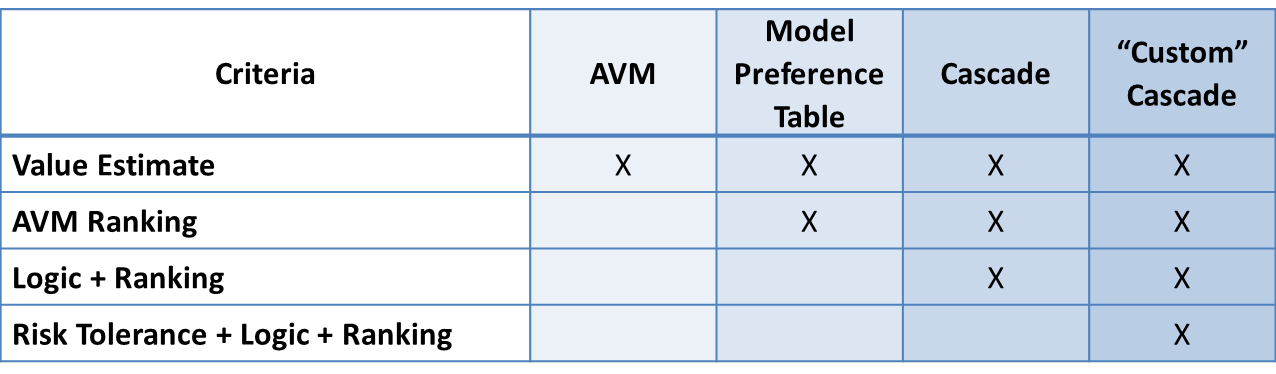
Regarding cascades, the Brookings’ paper leans on cascades as an important part of the solution for less discriminatory AVMs. We agree with Brookings: a cascade is the most sophisticated way to use AVMs.  It maximizes accuracy and minimizes forecast error and risk. By subscribing to multiple AVMs, you can rank-order them to choose the highest performing AVM for each situation, which we call using a Model Preference Table™. The best possible AVM selection approach is a cascade, which combines that MPT™ with business logic to define when an AVM’s response is acceptable and when it should be set aside for the next AVM or another form of valuation.  The business logic can incorporate the Forecast Standard Deviation provided by the model and the institution’s own risk-tolerance to determine when a value estimate is acceptable.

Mark Sennott (industry insider) recently published a whitepaper describing current issues with cascades, namely that some AVM resellers will give favorable positions to AVMs based on favors, pricing or other factors that do NOT include performance as evaluated by independent firms like AVMetrics. This goes to the additional transparency for which Brookings’ advocates. We’re all in favor.

We actually see a strong parallel between Mark Sennott’s whitepaper and the Brookings’ paper. Brookings makes the case to regulators, whereas Sennott was speaking to the AVM industry, but both of them argue for more transparency and responsible leadership by the industry. Sennott appears to be very prescient, in retrospect.

In order to ensure that adequate testing is done regularly we recommend that a control be implemented to create transparency around how the GSE’s or other originators are performing their testing. This could be done in a variety of ways. One method might require the GSE or lending institution to indicate their last AVM testing date on each appraisal waiver. Regardless of how it’s done, the goal would be to create a mechanism that would increase commitment to appropriate testing. The GSE’s could provide a leadership role by demonstrating how they would like lending institutions to demonstrate their independent AVM testing as required by OCC 2010-42 and 2011-12.

In conclusion, we appreciate Brookings’ dedication to asking questions and providing perspective on the AVM industry. We share their goals for transparency, fairness, and accuracy. We believe that open dialogue and collaboration by all the valuation industry participants are the keys to advancing the responsible use of AVMs.

We look forward to continuing our contributions to the AVM community and working toward a brighter future for this essential technology.

Why Mark Sennott’s Whitepaper Stopped Us Cold

At AVMetrics, we have to admit having mixed feelings about Mark Sennott’s recent whitepaper on AVMs. We’re quite grateful for his praise on our testing, which he describes as “robust, methodical and truly independent.” He echoes some of our key concerns:

  • AVMs perform very differently, so it is important to test before using
  • AVM performance changes more frequently than you’d think
  • Everyone should employ a cascade using multiple AVMs, because it dramatically increases the accuracy of the delivered results.

However, there was something quite disconcerting in Mark’s telling of how AVMs are being used. In Mark’s words:

In practice, however, the top performing AVMs, based on independent testing performed by companies like AVMetrics, are not always the ones being delivered to lenders. The reason: self-interest on the part of the AVM delivery platforms who also sell and promote their own AVMs.

This very troubling delta between posture and operating practice had to be confronted first-hand by one of the lenders for which I provide guidance. What at first blush appeared as a straightforward exercise for the lender in vetting a platform provider’s cascade against AVMetrics independent testing results, became a ponderous journey to overcome contractual headwinds against a simple assurance the provider would indeed provide the highest scoring AVM model per AVMetrics recommendations. This was not the first time I experienced this apparent conflict of interest.

Kudos to Mark for writing openly about a practice that many in the industry would probably prefer that he kept quiet about.

Black Knight’s Cascade Improved

Black Knight just announced an addition to its ValuEdge Cascade. It will now include the CA Value AVM, developed by Collateral Analytics, which recently became a Black Knight company.

AVMetrics helped with the process, doing the independent testing used to optimize the cascade performance. Read more about it in their press release.

The Proper Way to Select an AVM

After determining that a transaction or property is suitable for valuation by an Automated Valuation Model (AVM), the first decision one must make is “Which AVM to use?” There are many options – over 20 commercially available AVMs – significantly more than just a few years ago.  While cost and hit rate may be considerations, model accuracy is the ultimate goal. A few additional estimates that are off by more than 20 percent can seriously increase costs. Inaccuracy can increase second-looks, cause loans not to close at all or even stimulate defaults down the road.

Which is the best AVM?

We test the majority of residential models currently available, and in the nationwide test in Figure #1 below, Model AM-39 (not its real name) was the top of the heap. It has the lowest average (absolute) error (MAE) by .1 over the 2nd place model.  Model AM-39 is a full percentage point better than the 5th ranked model, which is good, but that’s not everything. Model AM-39 has the highest percentage of estimates within +/- 10% (PPE10%). Model AM-39 has the 2nd lowest percentage of extreme overvaluations (>=20%, or RT20 Rate), an especially bad type of error indicating a significant overvaluation or Right Tailed error.

Figure 1: National AVM Ranking

If you were shopping for an AVM, you might think that Model AM-39 is the obvious choice. This model performs at the top of the list in just about every measure, right? Well, not so fast. Consider that those measurements are based on testing AVM’s across the entire nation, and if you are only doing business in certain geographies, you might only care about which model or AVM is most accurate in those areas. Figure 2 shows a ranking of models in Nevada, and if your heart was set on Model AM-39, then you would be relieved to see that it is still in the top 5. And, in fact, it performs even better when limited to the State of Nevada. However, three models outperform Model AM-39, with Model X-24 leading the pack in accuracy (albeit with a lower Hit Rate).

Figure 2 Nevada AVM Rankings

So, now you might be sold on Model X-24, but you might still look a little deeper. If, for example, you were a credit union in Clark County, you might focus on performance there. While Clark County is pretty diverse, it’s quite different from most other counties in Nevada. In this case, Figure 3 shows that the best model is still, Model X-24, and it performs very well at avoiding extreme overvaluations.

Figure 3 Clark County AVM Rankings

However, if your Clark County Credit Union is focused on entry level home loans with properties values below $100K, you might want to check just that segment of the market. Figure 4 shows that Model X-24 continues to be the best performer in Clark County for this price tier. Note that the other top models, including Model AM-39, show significant weaknesses as their overvaluation tendency climbs into the teens. This is not a slight difference, and it could be important. Model AM-39 is seven times more likely than Model X-24 to overvalue a property by 20%, and those are high-risk errors.

Figure 4 Clark County AVM Rankings, <$100K Price Tier

Look carefully at the model results in Figure 4 and you’ll see that Model X-24, while being the most accurate and precise, has the lowest hit rate. That means that about 40% of the time, it does not return a value estimate. The implication is: you really want a second and a third AVM option.

Now let’s consider a different lending pattern for the Clark County credit union. Consider a high value property lending program and look at figure 5, which is an analysis of the over-$650K properties and how the models perform in that price tier. Figure 5 shows that Model X-24 is no longer in the top five models. The best performer in Clark County for this price tier is Model AM-39, with 92% within +/-10% and zero overvaluation error in excess of 20%. The other models in the top five also do a good job of valuing properties in this tier.

Figure 5 Clark County AVM Ranking, >$650K Price Tier

Figure 6 summarizes this exercise, which demonstrates the proper thinking when selecting models. First, focus on the market segment that you do business in – don’t use the model that performs best outside your service area. Second, rather than using a single model, you should use several models prioritized into what we call a “Model Preference Table®” in which models are ranked #1, #2, #3 for every segment of your market. Then, as you need to request an evaluation, the system should call the AVM in the #1 spot, and if it doesn’t get an answer, try the next model(s) if available.

Figure 6 Summary of AVM Rankings

In this way, you get the most competent model for the job. Even though one model will test better overall, it won’t be the best model everywhere and for every property type and price range.  In our example, the #1 model in the nation was not the preferred model in every market segment we focused on. If we had focused on another geography or market segment, we almost certainly would have seen a reordering of the rankings and possibly even different models showing up in the top 5. The next quarter’s results might be different as well, because all the models’ developers are constantly recalibrating their algorithms; inputs and conditions are changing, and no one can afford to stand still.

Cascade vs Model Preference Table® – What’s the Difference?

In the AVM world, there is a bit of confusion about what exactly is a “cascade.” It’s time to clear that up.  Over the years, the terms “cascade” and “Model Preference Table®” have been used interchangeably, but at AVMetrics, we draw an important distinction that the industry would do well to adopt as a standard.

In the beginning, as AVM users contemplated which of several available models to use, they hit on the idea of starting with the preferred model, and if it failed to return a result, trying a second model, and then a third, etc.  This rather obvious sequential logic required a ranking, which was available from testing, and was designed to avoid “value shopping.”[1]  More sophisticated users ranked AVMs across many different niches, starting with geographical regions, typically counties.  Using a table, models were ranked across all regions, providing the necessary tool to allow a progression from primary AVM to secondary AVM and so on.

We use the term “Model Preference Table” for this straightforward ranking of AVMs, which can actually be fairly sophisticated if they are ranked within niches that include geography, property type and price range.

More sophisticated users realized that just because a model returned a value does not mean that they should use it.  Models typically deliver some form of confidence in the estimate, either in the form of a confidence score, reliability grade, a “forecasted standard deviation” (FSD) or similar measure derived through testing processes.  Based on these self-measuring outputs from the model, an AVM result can be accepted or rejected (based on testing results) in favor of the next AVM in the Model Preference Table.  This application reflects the merger of MPT rankings with decision logic, which in our terminology makes it a “cascade.”

CriteriaAVMMPT®Cascade“Custom” Cascade
Value EstimateXXXX
AVM RankingXXX
Logic + RankingXX
Risk Tolerance + Logic + RankingX


The final nuance is between a simple cascade and a “custom” cascade.  The former simply sets across-the-board risk/confidence limits and rejects value estimates when they fail to meet the standard.  For example, the builder of a simple cascade could choose to reject any value estimate with an FSD > 25%.  A “custom cascade” integrates the risk tolerances of the organization into the decision logic.  That might include lower FSD limits in certain regions or above certain property values, or it might reflect changing appetites for risk based on the application, e.g., HELOC lending decisions vs portfolio marketing applications.

We think that these terms represent significant differences that shouldn’t be ignored or conflated when discussing the application of AVMs.


Lee Kennedy, principal and founder of AVMetrics in 2005, has specialized in collateral valuation, AVM testing and related regulation for over three decades.  Over the years, AVMetrics has guided companies through regulatory challenges, helped them meet their AVM validation requirements, and commented on pending regulations. Lee is an author, speaker and expert witness on the testing and use of AVMs. Lee’s conviction is that independent, rigorous validation is the healthiest way to ensure that models serve their business purposes.

[1] OCC 2005-22 (and the 2010 Interagency Appraisal and Evaluation Guidelines) warn against “value shopping” by advising, “If several different valuation tools or AVMs are used for the same property, the institution should adhere to a policy for selecting the most reliable method, rather than the highest value.”

Cascade vs Model Preference Table – What’s the Difference?

In the AVM world, there is a bit of confusion about what exactly is a “cascade.” It’s time to clear that up.  Over the years, the terms “cascade” and “Model Preference Table”TM have been used interchangeably, but at AVMetrics, we draw an important distinction that the industry would do well to adopt as a standard.

In the beginning, as AVM users contemplated which of several available models to use, they hit on the idea of starting with the preferred model, and if it failed to return a result, trying a second model, and then a third, etc.  This rather obvious sequential logic required a ranking, which was available from testing, and was designed to avoid “value shopping.”[1]  More sophisticated users ranked AVMs across many different niches, starting with geographical regions, typically counties.  Using a table, models were ranked across all regions, providing the necessary tool to allow a progression from primary AVM to secondary AVM and so on.

We use the term “Model Preference Table” for this straightforward ranking of AVMs, which can actually be fairly sophisticated if they are ranked within niches that include geography, property type and price range.

More sophisticated users realized that just because a model returned a value does not mean that they should use it.  Models typically deliver some form of confidence in the estimate, either in the form of a confidence score, reliability grade, a “forecasted standard deviation” (FSD) or similar measure derived through testing processes.  Based on these self-measuring outputs from the model, an AVM result can be accepted or rejected (based on testing results) in favor of the next AVM in the Model Preference Table.  This application reflects the merger of MPT rankings with decision logic, which in our terminology makes it a “cascade.”
MPT vs Cascade vs Custom Cascade

The final nuance is between a simple cascade and a “custom” cascade.  The former simply sets across-the-board risk/confidence limits and rejects value estimates when they fail to meet the standard.  For example, the builder of a simple cascade could choose to reject any value estimate with an FSD > 25%.  A “custom cascade” integrates the risk tolerances of the organization into the decision logic.  That might include lower FSD limits in certain regions or above certain property values, or it might reflect changing appetites for risk based on the application, e.g., HELOC lending decisions vs portfolio marketing applications.

We think that these terms represent significant differences that shouldn’t be ignored or conflated when discussing the application of AVMs.


Lee Kennedy, principal and founder of AVMetrics in 2005, has specialized in collateral valuation, AVM testing and related regulation for over three decades.  Over the years, AVMetrics has guided companies through regulatory challenges, helped them meet their AVM validation requirements, and commented on pending regulations. Lee is an author, speaker and expert witness on the testing and use of AVMs. Lee’s conviction is that independent, rigorous validation is the healthiest way to ensure that models serve their business purposes.

[1] OCC 2005-22 (and the 2010 Interagency Appraisal and Evaluation Guidelines) warn against “value shopping” by advising, “If several different valuation tools or AVMs are used for the same property, the institution should adhere to a policy for selecting the most reliable method, rather than the highest value.”