After running our legacy and PTM™ testing processes in parallel for several years, AVMetrics has formally completed its transition to Predictive Testing Methodology (PTM™) as our sole testing platform. The legacy testing process has been retired.
This transition was not abrupt, and it was not done in isolation. On the contrary, this milestone marks the completion of a multi-year effort that involved model-builders and AVM users.
Model vendors participated actively in PTM™ testing, recognizing the importance of delivering results that better reflect how their models perform for end users—lenders, servicers, and investors. Over the past several years, AVMetrics worked in close collaboration with AVM vendors and institutional clients to evaluate both approaches side by side. This parallel period gave our clients, AVM vendors, and our own team the opportunity to validate results side by side. That validation is now conclusive, and continuing to maintain the legacy system no longer serves the needs of the industry.
Why the legacy method is being retired
Traditional AVM testing compares model estimates to sale prices after those prices—and the listing data that precedes them—are already available to the models. As we’ve documented extensively, many AVMs incorporate MLS listing prices into their estimates, a phenomenon known as listing price anchoring, which inflates apparent accuracy in ways that don’t reflect real-world performance. When a model knows the listing price before producing its estimate, the resulting test measures something closer to consistency with known information than true predictive accuracy.
The anchoring effect isn’t theoretical—it’s quantified. Zillow reports a median error of approximately 1.7% for on-market homes but 7.2% for off-market homes. Redfin reports nearly identical figures: roughly 2.0% on-market and 7.6% off-market. That gap—a three- to four-fold difference in accuracy—represents the influence of listing price anchoring on AVM performance. Independent analysis by the AEI Housing Center corroborates this: their 2024 evaluation of five AVM providers found that “springiness”—how much a model’s estimate jumps when listing or sale prices become available—showed the widest variance in scores of any criterion tested, with some providers receiving failing grades. Since the vast majority of AVM use cases involve unlisted properties—refinances, home equity lending, portfolio assessments, loss mitigation—testing that includes listing data paints a misleading picture of how models will actually perform when it counts.
PTM™ solves this by using AVM estimates produced before properties are listed. Our Model Repository Database (MRD™) stores monthly valuations for every residential property in America from every participating AVM. By matching these pre-listing estimates against eventual arm’s-length sale prices, we isolate each model’s genuine predictive capability on a level playing field.
Aligned with regulatory expectations
This transition also reflects longstanding supervisory expectations for how AVMs should be tested, validated, and governed. While regulatory frameworks have evolved toward a more principles-based approach, the core elements of sound model oversight remain consistent: independent validation, outcomes-based testing, and a clear understanding of model limitations. Three authorities continue to frame these expectations:
To ensure unbiased test results, institutions should compare AVM results to actual sales data in a specified trade area or market prior to the information being available to the model. If more than one AVM is used, each should be validated.
Institutions should evaluate the underlying data used in the model(s), including data sources and types, frequency of updates, quality control performed on the data, and the sources of data in states where public real estate sales data are not disclosed.
Institutions should not rely solely on validation representations provided by an AVM vendor.
Model Risk Management Expectations. Current supervisory guidance reinforces the importance of:
Independent validation and effective challenge
Outcomes analysis comparing model outputs to real-world results
Ongoing monitoring aligned to model use and materiality
AVM Quality Control Standards (2025). The QC Standards establish that AVMs must be accurate, reliable, and nondiscriminatory, with institutions responsible for testing, monitoring, and controlling for bias and performance risk. While the QC Standards do not prescribe a specific methodology, it places responsibility on institutions to demonstrate that their approach is reasonable and well-supported. PTM™ operationalizes these principles at scale: independent, pre-information testing against actual arm’s-length sales, conducted continuously across every participating model.
What this means for the industry
For lenders and AVM users: AVMetrics’ independent AVM testing now reflects how models actually perform in the scenarios that matter most—refinances, HELOCs, portfolio assessments, and other situations where no listing price exists. The results you receive are a more realistic measure of the accuracy you can expect in production.
For AVM vendors: This transition reflects a shared direction. Vendors have participated in and supported PTM™ testing, recognizing the importance of delivering performance transparency that aligns with client expectations. Vendors continue to receive anonymized comparative analysis showing where their models stand relative to the field.
For the industry: This marks a move toward a more consistent, independent, and forward-looking standard for AVM validation—one that supports better model selection, stronger governance, and more credible cascade optimization and compliance decisions.
What hasn’t changed
What hasn’t changed is our role.
AVMetrics continues to provide independent, transparent AVM testing and validation aligned with the expectations set forth in the Interagency Guidelines and AVM Quality Control Standards. This independence remains a key distinction. Many AVM performance reports available in the market are produced by model providers evaluating their own models. While these efforts provide useful monitoring insights, they do not offer the same level of objectivity, comparability, or cross-model evaluation. AVMetrics’ role continues to be providing a consistent, third-party view across all participating models, supporting a more complete and defensible understanding of performance. We rigorously evaluate model performance and deliver comparable, objective results across providers—supporting due diligence, model validation, and ongoing monitoring. We continue to provide Model Preference Tables™, cascade optimization, geographic performance rankings, and all of the analytical products our clients rely on.
Just as importantly, we continue to provide clear guidance on appropriate use:
When an AVM is fit for purpose
When one model is more appropriate than another
And when an AVM should not be relied upon at all
The scope and rigor of our testing have only increased. Our focus remains the same: enabling clients to make informed, defensible decisions about AVM use through independent validation and consistent, evidence-based analysis.
To appreciate what MISMO’s new AVM Common Confidence Score Standard accomplishes, it helps to know where confidence scores have been.
First-generation confidence score schemas were all over the map: 1–10, 1–100, A–B–C–D, High–Medium–Low. In 2005, Doug Gordon, PhD, then chief modeler at Freddie Mac, published a paper called Metrics Matter[i] in an attempt to explain and defend Freddie Mac’s High–Medium–Low schema. That paper ignited a broader industry effort to create a second generation: getting every AVM to calculate and publish a Forecast Standard Deviation (FSD) alongside its value estimate, providing a mathematically grounded and theoretically consistent measure of uncertainty. It was a genuine improvement. Unfortunately, independent testing revealed that not all models were calibrating FSD correctly — their projections did not match actual outcomes.
The AVM Quality Control Standards[ii] rule renewed attention on the problem[iii]. End users still couldn’t reliably compare one model’s confidence output to another’s. That frustration, combined with regulatory momentum, drove the third-generation effort: a truly common confidence score schema with the potential for industry-wide adoption. MISMO’s Common Confidence Score[iv] is that effort. Whether it becomes the enduring standard will depend on what happens next.
“Well Calibrated”
For the first time, there is a shared definition of what a confidence score should mean: the estimated probability that a valuation falls within plus or minus ten percent of the property’s actual market value. Until now, three AVM providers could report confidence scores of “92,” “B,” and “High” for the same property with no way to compare them or hold any of them to a consistent standard.[v] That clarity is genuinely valuable.
But defining what a confidence score should mean is not the same as knowing whether any particular score actually delivers on that definition. The MISMO guidance makes this plain: “for a Common Confidence Score model which is well calibrated, 85% of the AVM values with a Common Confidence Score of .85 will be within 10% of the market value.”
That leaves just one question: how do we know if a model is well calibrated? That is where the real work begins.
Calibration is distinct from accuracy. A model can produce reasonably accurate values overall while still assigning confidence scores that systematically overstate or understate the probability of being within the expected range. An AVM provider assigning a Common Confidence Score of 0.85 is making a specific, testable claim: that across all valuations carrying that score, roughly 85% should fall within ten percent of true market value. Whether that claim holds is not a matter of definition. It is a matter of evidence — evidence that requires testing.
The MISMO standard acknowledges this directly, noting that the Common Confidence Score “should be subject to regular testing to verify alignment with the above definition.” The standard identifies the need for testing. It does not supply it.
The Scale Problem
Calibration testing is not a simple accuracy check. To verify that a confidence score is well calibrated, you need to observe performance across many thousands of valuations, segmented by score range. You need enough observations in each confidence band to draw statistically meaningful conclusions. Too few data points in the 0.80–0.85 band, for instance, and you cannot determine whether the score is performing as claimed — you are left with approximation rather than verification.[vi]
For most lenders, assembling that volume of test data is genuinely out of reach. Community banks, credit unions, and mid-sized regional lenders may not originate enough loans in a given quarter to support a properly powered calibration test. The only institutions potentially capable of approaching this problem with adequate sample sizes are the largest in the country.
Geography Compounds the Problem
AVM performance is not uniform across geography, and confidence score calibration is no exception. A model that is well calibrated nationally may perform poorly in specific markets — rural counties with low transaction volumes, rapidly appreciating urban submarkets, or areas with heterogeneous housing stock.
A lender operating in those markets needs to know how confidence scores perform there, not just on average. Geographic segmentation requires substantially more data than aggregate testing. Assessing calibration at the county or MSA level requires a dataset large enough to support meaningful analysis in each geography and each score cohort separately — a threshold well beyond the reach of most institutions. A confidence score that performs well nationally but poorly in the counties where a lender does business is not protecting that lender.
Who Verifies the Score?
The MISMO standard represents a voluntary industry commitment to a shared definition. It does not require AVM providers to submit their confidence score models to independent external testing. The verification of calibration is left to the users of those scores — institutions that often lack the data volume and infrastructure to do it rigorously.
This is the structural problem. The models themselves have the ability to test their own confidence scoring, and they certainly do — but they cannot be independent in that assessment. Very few AVM users have the capability to perform that testing. That gap is what independent testing is designed to address.
The AVM Quality Control Standards that took effect in October 2025 require institutions to maintain policies and procedures ensuring a high level of confidence in AVM estimates. Verifying that confidence scores mean what they claim to mean is precisely what that requirement demands.
MISMO has done the work of defining the target. Independently verifying that AVM providers are hitting it — across the full range of markets and conditions on which lenders depend — is the work that follows.
AVMetrics is an independent AVM testing and validation firm serving banks, credit unions, nonbank lenders, and AVM providers. AVMetrics tests AVM performance against actual sale prices across a national dataset of 500,000 to 700,000+ records per quarter, covering 1,700 counties representing 96+% of the U.S. population. Join our community at avmetrics.net to stay up-to-date.
[i] Douglas Gordon, Metrics Matter, The Thomson Corporation and National Mortgage News at 1 (2005).
[iv]AVM Common Confidence Score Standard & Guidance, Version 1.0 (July 2025), Mortgage Industry Standards Maintenance Organization, Inc. (MISMO).
[v] While AVM providers’ native confidence scores have not been comparable, independent testing methodologies (e.g., AVMetrics’ Predictive Testing Methodology (PTM™)) have provided a consistent, empirically grounded basis for cross-model comparison and validation.
[vi] See William G. Cochran, Sampling Techniques (3rd ed. 1977). Cochran’s formula establishes the minimum sample size required to achieve a desired confidence level and margin of error, underscoring the need for sufficiently large sample sizes within each segmented group.
The Fair Housing analyses published by AVM vendors such as Veros and Clear Capital represent important early efforts to evaluate potential disparate impact in automated valuation models. These studies contribute useful perspective to an evolving area of the industry, but they are inherently constrained by scope, methodology, and—most importantly—objectivity. Their findings are self-assessments rather than independent evaluations: each vendor analyzes only its own model, using its own data and assumptions, and typically concludes that little to no bias exists, which limits their usefulness for broader risk management and supervisory purposes.
Regulated institutions, however, must operate under much more rigorous expectations. The new Interagency AVM Quality Control Standards require lenders to demonstrate that AVMs used in credit decisions are independently validated and fairly applied. This standard cannot be meaningfully satisfied by vendor-authored whitepapers alone.
AVMetrics’ methodology is designed specifically to meet these supervisory needs. Rather than focusing on individual model performance within internally defined samples, AVMetrics conducts standardized, national-level testing across 700,000 to 1 million transactions each quarter. This approach ensures that fairness conclusions reflect real-world market diversity and enables consistent evaluation across models, markets, and time.
AVMetrics independently tests eight different dimensions in which AVMs could potentially disadvantage protected classes, including coverage rates (hit rate), accuracy, precision, and other core performance measures. To support statistically meaningful comparisons, AVMetrics has invested in neighborhood-level demographic data, enabling analysis across comparison neighborhoods- avoiding the masking effects of county-level aggregation while preserving sufficient sample size beyond census-tract granularity.
Further, AVMetrics applies Standardized Mean Difference (SMD)—the same effect-size metric commonly used in fair-lending analytics—providing a clear measure of whether disparities are material, not simply detectable. In contrast, many model-specific analyses typically use raw accuracy differences or simple correlations, which offer no interpretive scale for examiners assessing practical significance. AVMetrics’ approach produces metrics that are grounded in established methodology, interpretable, and defensible.
As the next generation of AVMs incorporates increasingly complex machine learning and generative AI techniques, vendor-driven testing becomes even less transparent. AVMetrics’ methodology is intentionally model-agnostic: we can evaluate the fairness and performance of traditional hedonic models, GBDT-based systems, deep learning models, or hybrid AI architectures with equal rigor. As models become more opaque, the need for a neutral, independent evaluator becomes increasingly essential.
In contrast to analyses intended to provide general assurance around individual models, AVMetrics delivers regulatory-grade evidence. By identifying how model risk and policy risk can interact to generate disproportionate impacts—an expectation embedded in the new regulatory framework—our testing equips lenders with the actionable intelligence needed to inform, calibrate, and justify their risk-policy decisioning.
As regulatory expectations around AVM fairness continue to mature, institutions must move beyond model-specific assurances toward independent, repeatable, and scalable evaluation frameworks. AVMetrics’ fair housing methodology is purpose-built to meet these expectations, providing lenders with nationally consistent, statistically rigorous, and model-agnostic evidence of AVM performance and potential disparate impact. By aligning testing design with supervisory standards and real-world production environments, AVMetrics enables institutions not only to identify and manage fair-lending risk, but also to demonstrate compliance with confidence in increasingly complex valuation ecosystems.
In our menu above, under “AVM Information” we always have the latest version of our testing schedule. 2026 AVM Validation Testing Dates have been published there as of today.
The Automated Valuation Model (AVM) industry is entering a critical phase—one where regulatory oversight is increasing, use cases are expanding, and performance analysis is under sharper scrutiny. In this environment, testing methodologies must evolve to ensure transparency, fairness, and real-world relevance. A recent whitepaper from Veros Real Estate Solutions, “Optimizing AVM Testing Methodologies,” advocates flawed logic that risks reversing progress in predictive model testing and validation.
This op-ed offers an affirmation of the core tenets of what is becoming the industry-standard testing framework: a data-driven testing methodology grounded in sound and prudent validation principles. While Veros challenges this approach, the broader AVM ecosystem—including regulators, lenders, and nearly all major AVM providers—have embraced a process that prioritizes objective, real-world performance measurements over now antiquated methods allowing for data leakage into the Automated Valuation Model.
The Listing Price Issue
The whitepaper in question should be understood as a salvo in the battle over listing prices and their influence on AVMs. Several industry participants have come out with analyses showing that when AVMs incorporate listing price data into their models, they perform much better in tests, but those test results are likely to be a poor reflection of real-world model performance. This is because in most use cases for AVMs, there is no listing price available – think of refinance and HELOC transactions, portfolio risk analyses or marketing (SeeAV Metrics August 29, 2024 whitepaper[1] or the AEI Housing Center’s Study of AVM Providers[2]).
Specific Issues in Veros’ “Optimizing…”
Below are seven points made in the aforementioned paper that don’t stand up to scrutiny. Let’s break them down one at a time.
Mischaracterization of the Listing Price Concern
Whitepaper Claim: “Knowing the list price doesn’t necessarily equate to knowing the final sale price.” The paper not only puts forward the strawman that others claim that listing prices are equal to sales prices, but it also rather awkwardly asserts that listing prices are not very useful to AVMs
Response: This argument overlooks a key behavioral phenomenon: anchoring. When listing prices are published, they tend to drive sale prices and valuations toward that price[3]. When listing prices become available to AVMs during testing, model outputs shift—often sharply—toward those prices. Look no further than one of the most prominent AVMs on the market, Zillow. They are a very transparent company and publish their accuracy statistics monthly, and when they do, they measure them with and without listing data available, because the accuracy results are strikingly different. As of August 2025, Zillow’s self-reported median error rate is 1.8% when listing prices are available and 7.0% when they are not.[4]
AEI noted this phenomenon in their recent analysis of multiple AVMs from 2024, “Results on the AEI Housing Center’s Evaluation of AVM Providers[5].” AEI referred to it as “springiness” because graphs of price estimates “spring” to the listing price when that data becomes available. The result is inflated performance metrics that don’t reflect true, unassisted, predictive ability. And finally, this issue has been empirically documented in AV Metrics’ internal studies and external publications.
When AVMs are tested with access to listing prices, vendors can tune their models to excel under known test conditions rather than perform reliably across real-world scenarios. This undermines model governance, especially for regulated entities, and conflicts with both OCC and IAEG guidance emphasizing model transparency, durability, and independence.
The solution being adopted as the emerging standard is simple but powerful: only use valuations generated before the listing price becomes known. This ensures unanchored estimates using real-world scenarios where listing prices are unavailable—a more accurate reflection of likely outcomes for use cases such as refinance, home equity, and portfolio surveillance.
Refinance Testing and the Fallacy of Appraisal Benchmarks
Whitepaper Claim: “Appraised values are the best (and often only) choice of benchmarks in this lending space currently as they are the default valuation approach used to make these lending decisions.”
Response: Appraisals are opinion-based and highly variable. In fact, Veros’ own white paper acknowledges that appraisals exhibit high variance, a concession that undermines their validity as testing benchmarks. Appraisal opinions are not standardized enough to provide consistent benchmarks as a measure for AVM accuracy.
Regulatory guidance also emphasizes the superiority of transactions over appraisals for AVM testing. Appendix B of the Interagency Appraisal and Evaluation guidance, December, 2010[7], still the most current guidance of AVM testing, specifically states, “To ensure unbiased test results, an institution should compare the results of an AVM to actual sales data in a specified trade area or market prior to the information being available to the model.”
Mischaracterization of Pre-Listing Valuations as “Outdated”
Whitepaper Claim: The whitepaper asserts that validation results using pre-listing AVM values are artificially low, asserting that these values are outdated and fail to reflect current market conditions. While Veros stops short of using the phrase “outdated and unfair,” that is the unmistakable thrust of their argument: that pre-listing AVM estimates do not reflect real-world usage and disadvantage high-performing models. In the webinar discussion of the whitepaper, Veros repeatedly suggested that “Pre-MLS” testing might use AVM value estimates that were 9 months old.
Response: This claim is both overstated and analytically misleading.
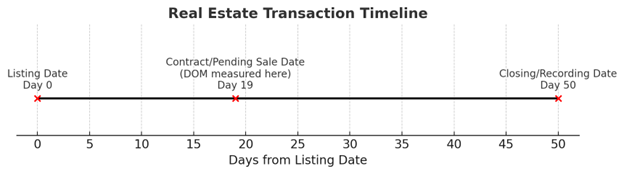
PTM testing never uses values that are 9 months old, and industry participants know that, because they are familiar with the methodology and AV Metrics’ paper describing it[8]. The reality is that almost all AVM values used in PTM testing were created mere weeks or a month or two prior to the relevant date, which is the contract date. The Veros paper uses confusion over different dates in the process of a real estate transaction to muddy the waters. The timeline below shows how the “median DOM” referred to in the paper and commonly published in business articles is not representative.
The typical transaction takes 50 days from listing to completion, but typically only 19 days from listing to contract. (April 2025)
In the real estate industry, Days on Market (DOM) is often defined as the number of days from Listing Date to Closing/Recording Date. Sources like FRED and Realtor.com report median DOM this way, which for April 2025 was about 50 days.
However, for valuation relevance, the more important measure is the time from Listing Date to Contract/Pending Sale Date—the point when the actual price agreement is made. This is typically much shorter—our April 2025 Zillow data show a median of 19 days nationally.
This matters because AVM predictions made just before the listing date are often only weeks ahead of the market decision point, not months. By contrast, the “closing” date used in some public stats is just a paperwork formality that lags well behind the actual market valuation event.
Furthermore, residential real estate markets do not shift dramatically week to week. The suggestion that valuations generated days or a few weeks prior to the listing date are best characterized as outdated misunderstands the pace of market change and misrepresents the data.
Using pre-listing AVM values does not disadvantage models, nor are those values meaningfully outdated. On the contrary, PTM removes a long-standing bias—early access to listing prices—and holds all AVMs to the same fair standard. The result is a more objective, transparent, and predictive test that rewards modeling performance rather than data timing advantage.
Key Points:
Veros’ “9 months” claim is unrealistic—typical contract timing is closer to 2–4 weeks after listing.
Residential markets move slowly: 1–2% change over several months, often less.
Any slight “age” in pre-listing AVM estimates is minimal, consistent across all models, and far outweighed by the benefit of removing listing price bias.
When tested properly, AVMs show robust performance even when limited to pre-listing data, proving that predictive strength—not access to post-listing artifacts—is the proper basis for fair evaluation.
The Flawed Analogy to Appraisers
Whitepaper Claim (Paraphrased): Veros argues that AVMs should be allowed to use listing data in testing because appraisers do. The whitepaper pleads for AVMs to be allowed to operate like appraisers with access to listing data in order to compete with appraisers on a level playing field.
Response: This argument confuses different points. First, appraisers and AVMs are not equals competing on a level playing field. They are different processes for estimating market value. Appraisers are held to standards to develop and report appraisal estimates by the Uniform Standards of Professional Appraisal Practice. These types of standards are non-existent for AVMs. Perhaps to counter the lack of standards at the manufacturing end of the AVM estimates, model estimates are tested on the backend to evaluate accuracy and meet regulatory expectations. Appraisers aren’t subjected to the rigorous testing that AVMs go through, though appraisal users typically have review processes in place at both the transactional and portfolio levels.
Second, there are several different “uses of appraisal data” being conflated in this claim. AVMs are able to use many different types of data from listings in their models without objection. They often ingest pictures and text descriptions and they’ve developed very sophisticated AI techniques to tease out information from those descriptions.
But there is one specific issue under debate, and that is the use of the listing price information when AVMs are being tested. Users of AVMs need to understand how accurate a model will be when listing data is not available, as it is not available in most AVM use applications: e.g. refinances, HELOCs, portfolio valuation and risk assessment, etc. For testing to be most applicable to those situations and uses, AVM testing must be done on value estimates not “anchored” to listing prices.
AVMs are evaluated by statistical comparison to a benchmark. Injecting listing prices into the models contaminates the experiment, especially when that price closely tracks the final sale. Appraisers aren’t ranked side by side using controlled benchmarks. That difference is why AVMs should not be tested with access to listing prices, but they certainly should be able to use listing data.
False Equivalency with Assessed Values
Whitepaper Claim: “If we eliminate the use of MLS list prices, should we also argue for excluding other potentially useful data, such as that from a county property tax assessor?” The paper claims that other estimates of value available in the marketplace are not excluded by PTM testing, so it asks why listing prices should be singled out for exclusion.
Response: This argument is a strawman set up to be knocked down easily. Assessed values are stale and generally unrelated to current market value. They also tend to cover every property, meaning that they don’t privilege the small percentage of properties that will be used as benchmarks, thereby invalidating accuracy testing. But, most importantly, they do not create the same anchoring distortion that listing prices do. For these reasons, no one has suggested excluding assessor values, because it wouldn’t make sense. Later in the whitepaper, they answer their own rhetorical question by saying that it is “absurd” to consider eliminating access to assessor data. We wholeheartedly agree. It was, in fact, absurd to even suggest it.
Alternative Proposal: Measure Anchoring
Whitepaper Suggestion: The paper proposes using some statistical techniques to measure the amount that each AVM adjusts in response to listing prices.
Response: This suggestion is interesting for exploratory research, but it is not a viable alternative. It fails to address the basic question: how well does this model predict value when no listing price is available? The Predictive Testing Methodology (PTM) answers that question in a scalable, repeatable, and unbiased way. Simply calculating how much an AVM responds to listing prices does not accomplish that goal.
The Flaws of “Loan Application Testing”
Whitepaper Proposal: Veros suggests a new AVM testing approach based on pulling values at the time of loan application—arguing that this better reflects how AVMs are used in production, especially in purchase and refinance transactions.
Response: While this may sound pragmatic, in practice, “loan application testing” is deeply flawed as a validation methodology. It introduces bias, undermines statistical validity, and fails to meet regulatory expectations for model risk governance. Here’s why:
Not Anchoring-Proof If an AVM runs after the property is listed (as many do at loan application), it may already have ingested the list price or be influenced by it. This reintroduces anchoring bias—precisely what PTM is designed to eliminate.
Biased Sample and Survivorship Distortion Loan applications represent a non-random, self-selecting subset of properties. They exclude properties for which there is no loan application (about 1/3 of all sales are for cash and don’t involve a loan) as well as those that are quickly denied, withdrawn, or canceled. This sampling would severely bias testing.
Inappropriate Appraisal Benchmarks The mix of AVM testing benchmarks would vacillate between appraisals for refinance loan applications and sales for purchase applications. Depending on market conditions, refinance applications can make up 80+% of loan originations, which would mean that the vast majority of AVM testing would be based on appraisals, which are subjective and inappropriate as a benchmark.
Non-Standardized Collection & Timing There is no consistent, auditable national timestamp for “application date” across lenders. This creates operational inconsistency, poor reproducibility, and potential for cherry-picking.
Veros’ proposal is not a viable alternative to PTM. It lacks the rigor, scalability, and objectivity that predictive testing delivers—and it would fall short of the new federal Quality Control Standards requiring random sampling, conflict-free execution, and protections against data manipulation.
About the Author and the Need for Independent Testing
It is also important to acknowledge that the Veros whitepaper was authored by a model vendor—evaluating methodologies that directly affect its own model’s competitive standing. This is not an independent or objective critique. Veros is an active participant in the AVM space with commercial interests tied to model performance rankings. By contrast, Predictive Testing Methodology (PTM) is conducted by an independent third party, is openly adopted by nearly all major AVM vendors, and has become a trusted standard among lenders seeking impartial performance assessment.
Conclusion: Clarity Over Convenience
At its core, AVM testing is about one thing: accurately establishing an expectation of a model’s ability to predict the most probable sale price of a property. To achieve this, we must rely on objective benchmarks, control for data contamination, and apply consistent standards across models.
The Predictive Testing Methodology (PTM)—already adopted by nearly all major AVM providers—meets these criteria. It has been embraced by lenders and validated through years of use and peer-reviewed research. Anchored in OCC 2011-12 model validation guidance, IAEG principles, and the newly codified 2024 Final Rule on AVM Quality Control Standards, PTM ensures that AVMs are tested as they are used—in real-world, data-constrained conditions. These new federal standards require AVM quality control programs to:
Protect against data manipulation, such as anchoring to listing prices;
Avoid conflicts of interest, emphasizing the importance of independent testing providers;
Conduct random sample testing and reviews, ruling out cherry-picked case studies or selectively favorable data;
And comply with fair lending laws, requiring AVM frameworks to be broadly equitable and empirically validated.
Veros’ whitepaper makes the case for less rigorous framework. But flimsy frameworks serve vendors, not users, and especially not regulated users. They inflate performance, mask limitations, and misguide deployment. The industry would do well to resist this regression as such approaches would fall short of the standards now required by law.
The industry should reaffirm our commitment to testing that is transparent, unbiased, and fit for purpose. That is how to build AVM systems worthy of trust and meet both the expectations of regulators and the needs of a fair, stable housing finance system.
AV Metrics is an independent AVM testing firm specializing in performance analytics, regulatory compliance, and model risk management.
In our menu above, under “AVM Information” we always have the latest version of our testing schedule. 2025 AVM Validation Testing Dates have been published there as of today.
When it comes to residential property valuation, Automated Valuation Models (AVMs) have a lurking problem. AVM testing is broken and has been for some time, which means that we don’t really know how much we can or should rely on AVMs for accurate valuations.
Testing AVMs seems straightforward: take the AVM’s estimate and compare it to an arm’s length market transaction. The approach is theoretically sound and widely agreed upon but unfortunately no longer possible.
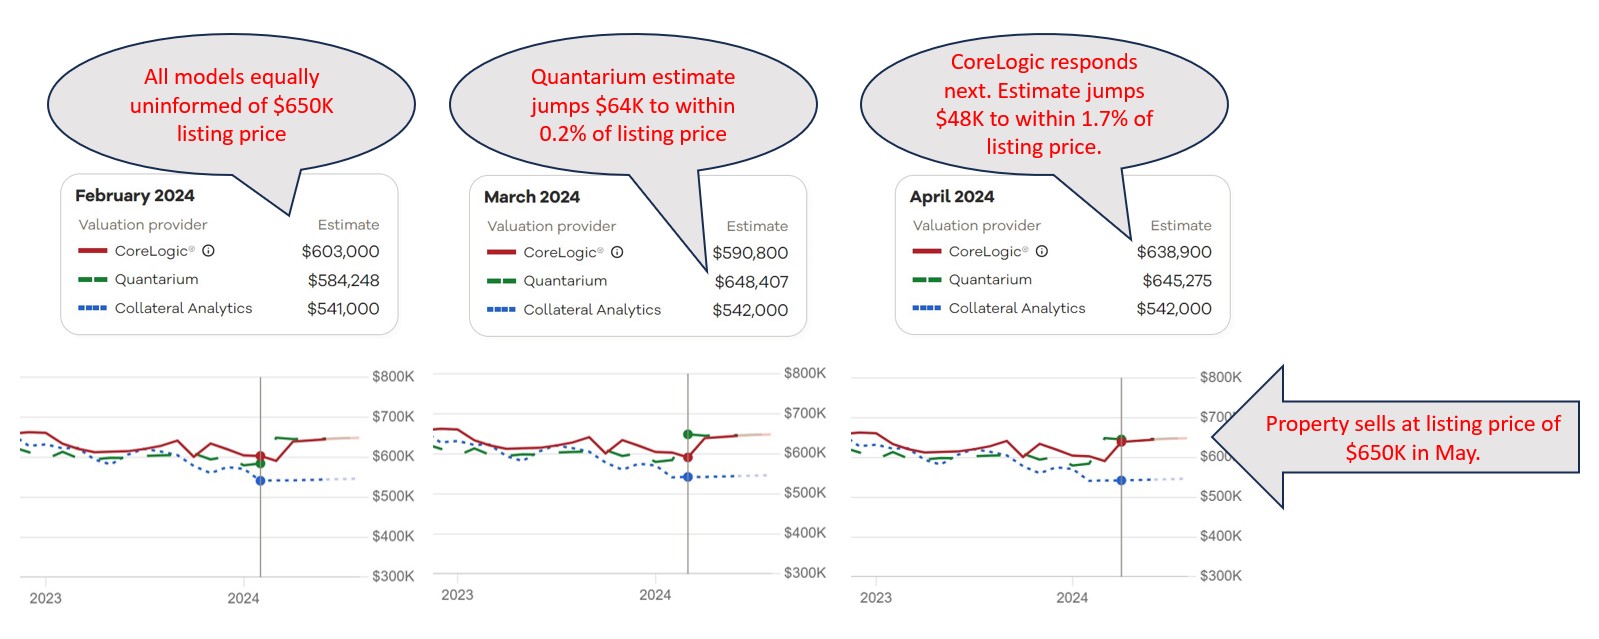
Once you see the problem, you cannot unsee it. The issue lies in the fact that most, if not all, AVMs have access to multiple listing data, including property listing prices. Studies have shown that many AVMs anchor their predictions to these listing prices. While this makes them more accurate when they have listing data, it casts serious doubt on their ability to accurately assess property values in the absence of that information.
Three AVMs valuing a home before and after it was listed in the MLS from Realtor.com’s RealEstimateSM.
All this opens up the question: what do we want to use AVMs for? If all we want is to get a good estimate of what price a sale will close at, once we know the listing price, then they are great. However, if the idea is to get an objective estimate of the property’s likely market value to refinance a mortgage or to calculate equity or to measure default risk, then they are… well, it’s hard to say. Current testing methodology can’t determine how accurate they are.
But there is promise on the horizon. After five years of meticulous development and collaboration with vendors/models, AVMetrics is proud to unveil our game-changing Predictive Testing Methodology (PTM™), designed specifically to circumvent the problem that is invalidating all current testing. AVMetrics’ new approach will replace the current methods cluttering the landscape and finally provide a realistic view of AVMs’ predictive capabilities.1
At the heart of PTM™ lies our extensive Model Repository Database (MRD™), housing predictions from every participating AVM for every residential property in the United States – an astonishing 100 to 120 million properties per AVM. With monthly refreshes, this database houses more than a billion records per model and thereby offers unparalleled insights into AVM performance over time.
But tracking historical estimates at massive scale wasn’t enough. To address the influence of listing prices on AVM predictions, we’ve integrated a national MLS database into our methodology. By pinpointing the moment when AVMs gained visibility into listing prices, we can assess predictions for sold properties just before this information influenced the models, which is the key to isolating confirmation bias. While the concept may seem straightforward, the execution is anything but. PTM™ navigates a complex web of factors to ensure a level playing field for all models involved, setting a new standard for AVM testing.
So, how do we restore confidence in AVMs? With PTM™, we’re enabling accurate AVM testing, which in turn paves the way for more accurate property valuations. Those, in turn, empower stakeholders to make informed decisions with confidence. Join us in revolutionizing AVM testing and moving into the future of improved property valuation accuracy. Together, we can unlock new possibilities and drive meaningful change in the industry.
1The majority of the commercially available AVMs support this testing methodology, and there is over two solid years of testing that has been conducted for over 25 models.
Regulators are signaling that they are going to be looking at how AVMs are used and whether lenders have appropriately tested them and continuously monitor them for valuation discrimination. This represents a change in the focus on AVMs and the need for all lenders to focus on AVM validation to avoid unfavorable attention from government regulators.
On Feb 12, the FFIEC issued a statement on examinations from regulators. It specifically stated that it didn’t represent a change in principles, nor a change in guidance, and not even a change in focus. It was just a friendly announcement about the exam process, which will focus on whether institutions can identify and mitigate bias in residential property valuations.
Law firm Husch Blackwell published their interpretation a week later. Their analysis included consideration of the June 2023 FFIEC statement on the proposed AVM quality control rule, which would include bias as a “fifth factor” when evaluating AVMs. They interpret these different announcements as part of a theme, an extended signal to the industry that all valuations, and AVMs in particular, are going to receive additional scrutiny. Whether that is because bias is as important as quality or because being unbiased is an inherent aspect of quality, the subject of bias is drawing attention, but the result will be a thorough examination of all practices around valuation, including AVMs, from oversight to validation, training, auditing, etc.
AVM quality has theoretically been an issue that could be enforced by regulators in some circumstances for over a decade. What we’re seeing is not just an expansion from accuracy into questions of bias. We’re also seeing an expansion from banks into all lenders, including non-bank lenders. And, they are signaling that examinations will focus on bias, which is an expansion from the theoretical requirement to an actual, manifest, serious requirement.
In our menu above, under “AVM Information” we always have the latest version of our testing schedule. 2024 AVM Validation Testing Dates have been published there as of today.