After determining that a transaction or property is suitable for valuation by an Automated Valuation Model (AVM), the first decision one must make is “Which AVM to use?” There are many options – over 20 commercially available AVMs – significantly more than just a few years ago. While cost and hit rate may be considerations, model accuracy is the ultimate goal. A few additional estimates that are off by more than 20 percent can seriously increase costs. Inaccuracy can increase second-looks, cause loans not to close at all or even stimulate defaults down the road.
Which is the best AVM?
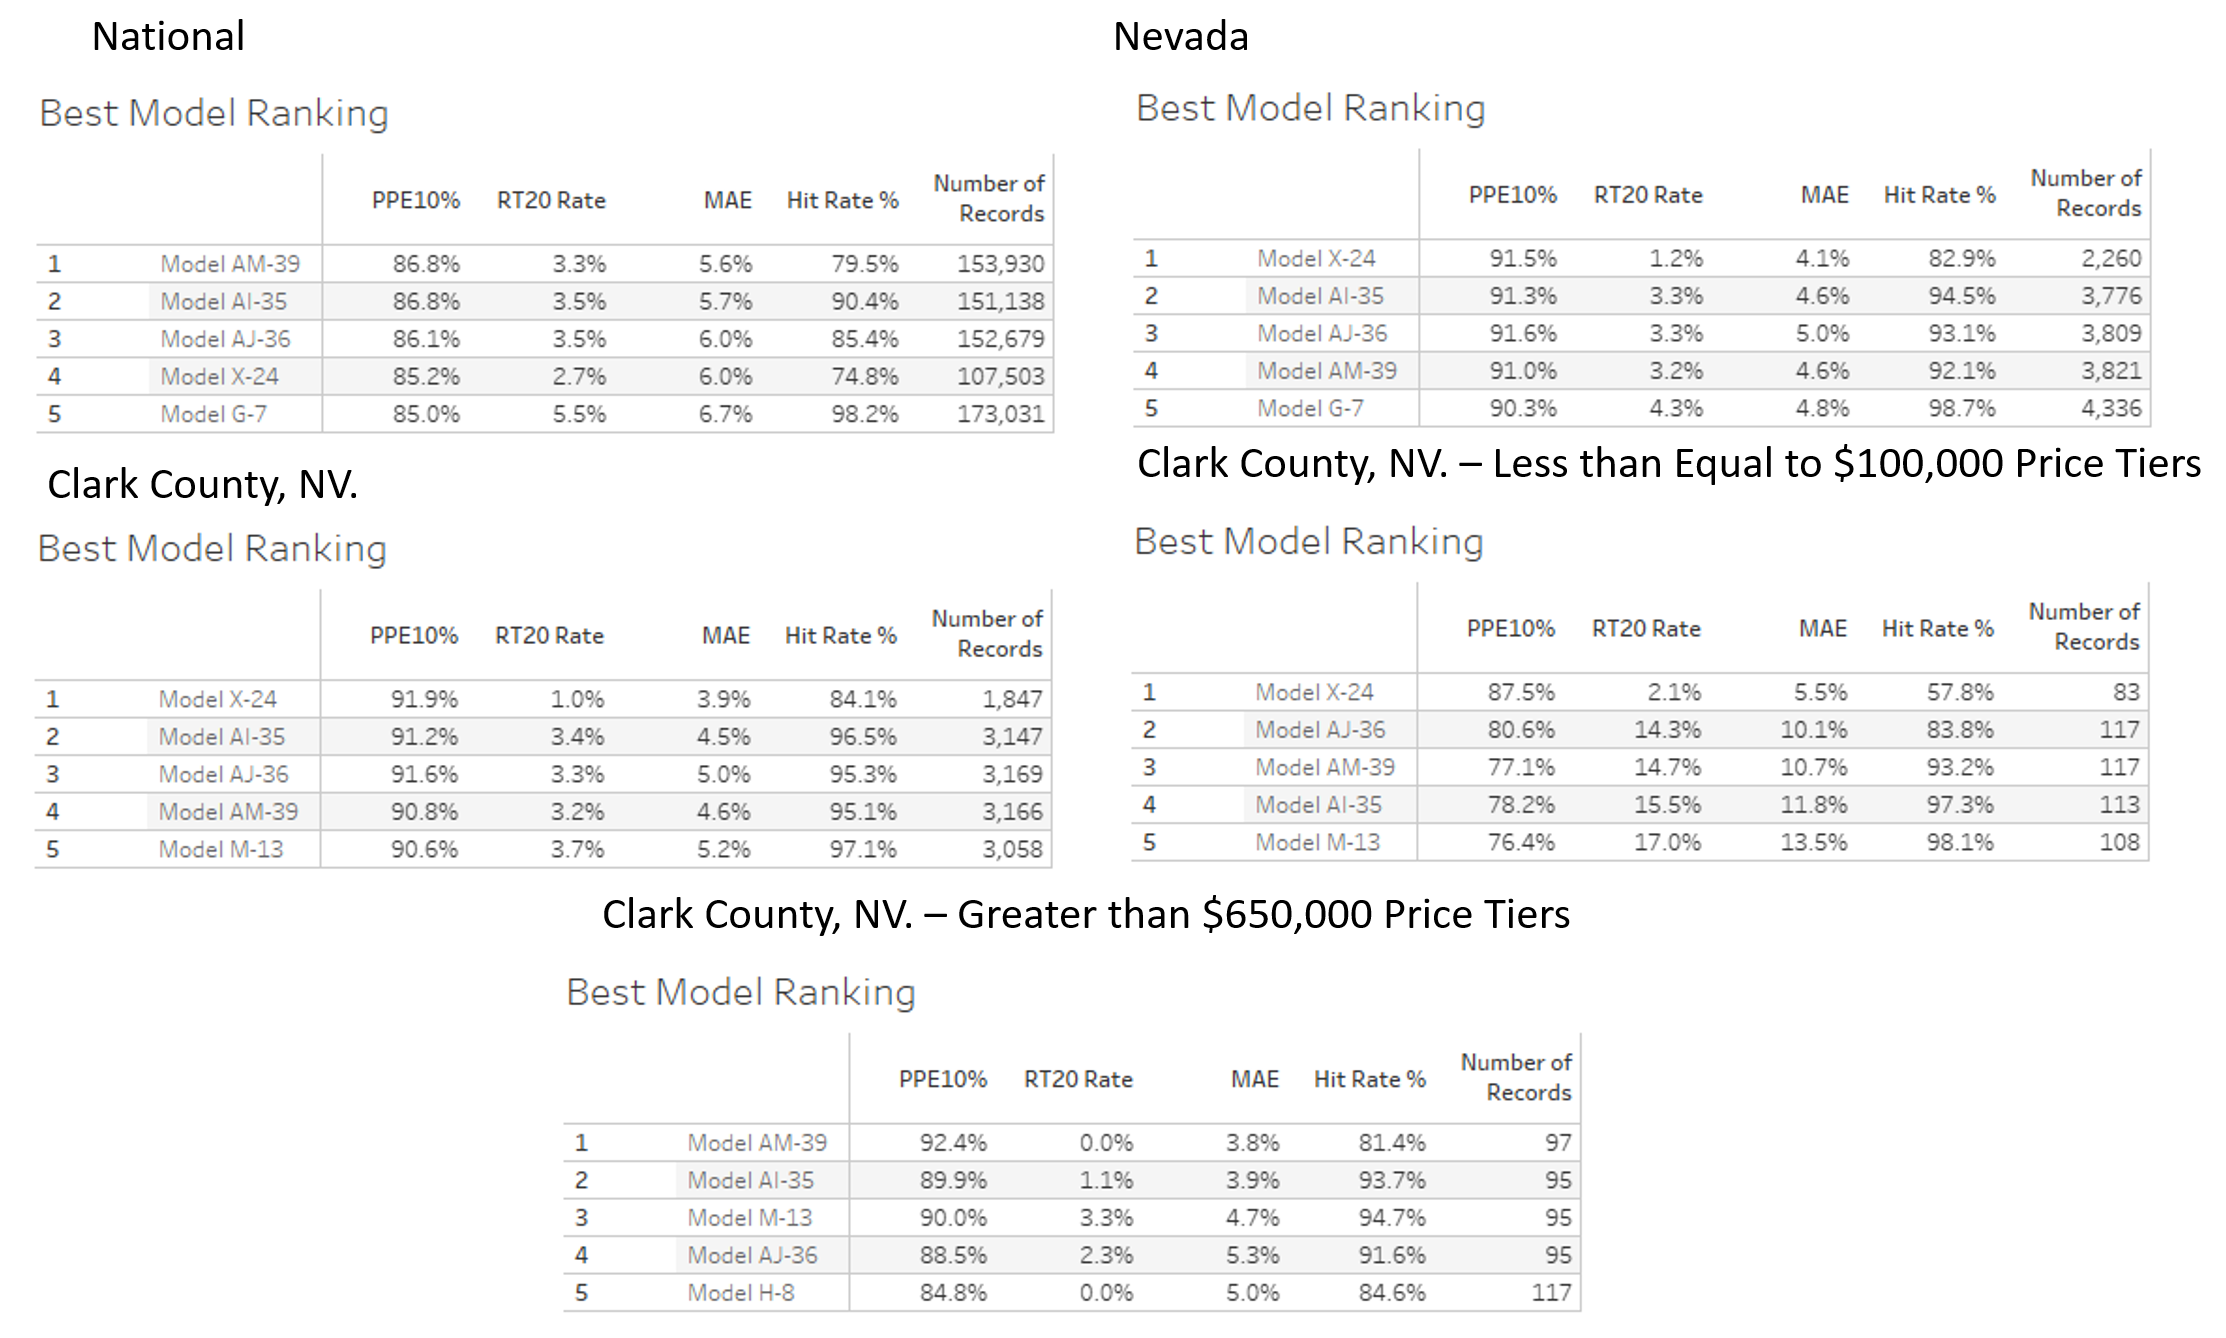
We test the majority of residential models currently available, and in the nationwide test in Figure #1 below, Model AM-39 (not its real name) was the top of the heap. It has the lowest average (absolute) error (MAE) by .1 over the 2nd place model. Model AM-39 is a full percentage point better than the 5th ranked model, which is good, but that’s not everything. Model AM-39 has the highest percentage of estimates within +/- 10% (PPE10%). Model AM-39 has the 2nd lowest percentage of extreme overvaluations (>=20%, or RT20 Rate), an especially bad type of error indicating a significant overvaluation or Right Tailed error.
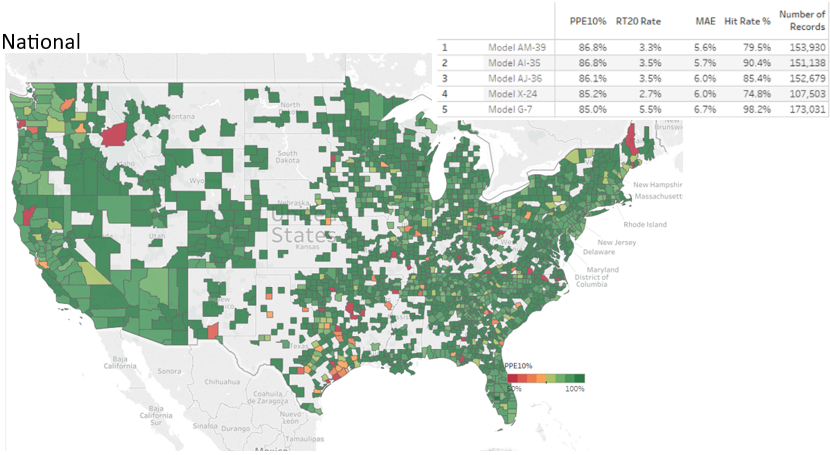
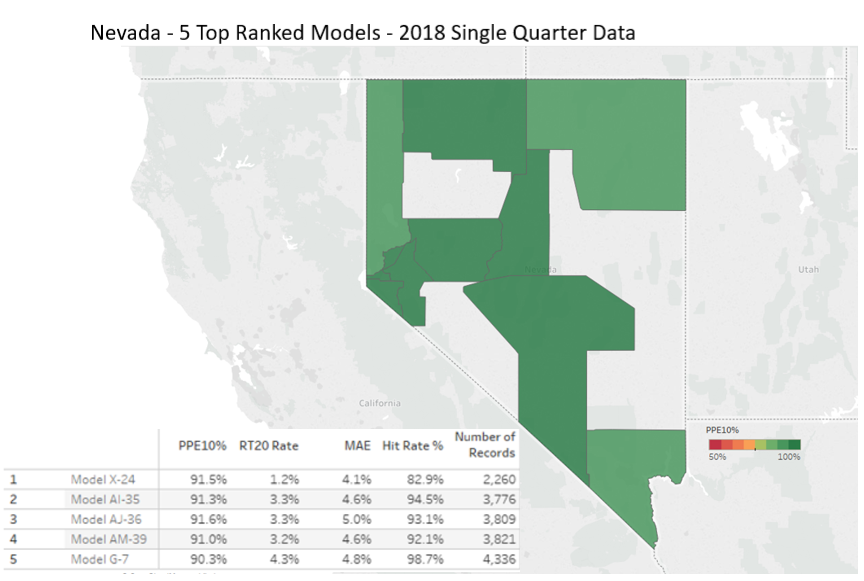
If you were shopping for an AVM, you might think that Model AM-39 is the obvious choice. This model performs at the top of the list in just about every measure, right? Well, not so fast. Consider that those measurements are based on testing AVM’s across the entire nation, and if you are only doing business in certain geographies, you might only care about which model or AVM is most accurate in those areas. Figure 2 shows a ranking of models in Nevada, and if your heart was set on Model AM-39, then you would be relieved to see that it is still in the top 5. And, in fact, it performs even better when limited to the State of Nevada. However, three models outperform Model AM-39, with Model X-24 leading the pack in accuracy (albeit with a lower Hit Rate).
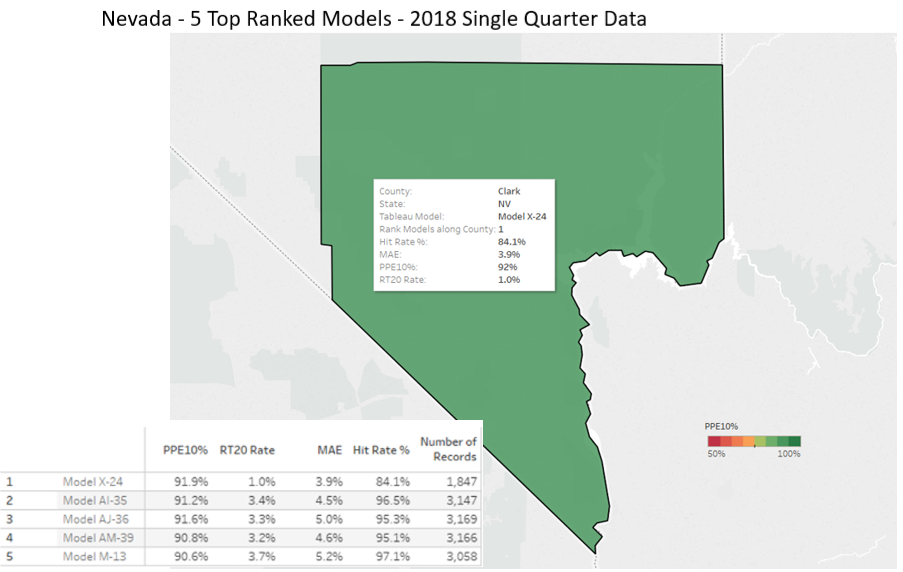
So, now you might be sold on Model X-24, but you might still look a little deeper. If, for example, you were a credit union in Clark County, you might focus on performance there. While Clark County is pretty diverse, it’s quite different from most other counties in Nevada. In this case, Figure 3 shows that the best model is still, Model X-24, and it performs very well at avoiding extreme overvaluations.
However, if your Clark County Credit Union is focused on entry level home loans with properties values below $100K, you might want to check just that segment of the market. Figure 4 shows that Model X-24 continues to be the best performer in Clark County for this price tier. Note that the other top models, including Model AM-39, show significant weaknesses as their overvaluation tendency climbs into the teens. This is not a slight difference, and it could be important. Model AM-39 is seven times more likely than Model X-24 to overvalue a property by 20%, and those are high-risk errors.
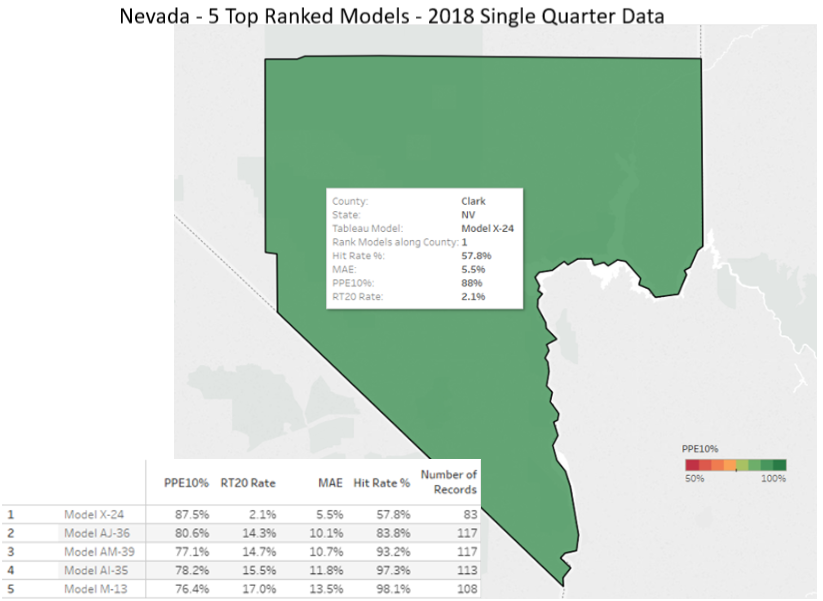
Look carefully at the model results in Figure 4 and you’ll see that Model X-24, while being the most accurate and precise, has the lowest hit rate. That means that about 40% of the time, it does not return a value estimate. The implication is: you really want a second and a third AVM option.
Now let’s consider a different lending pattern for the Clark County credit union. Consider a high value property lending program and look at figure 5, which is an analysis of the over-$650K properties and how the models perform in that price tier. Figure 5 shows that Model X-24 is no longer in the top five models. The best performer in Clark County for this price tier is Model AM-39, with 92% within +/-10% and zero overvaluation error in excess of 20%. The other models in the top five also do a good job of valuing properties in this tier.
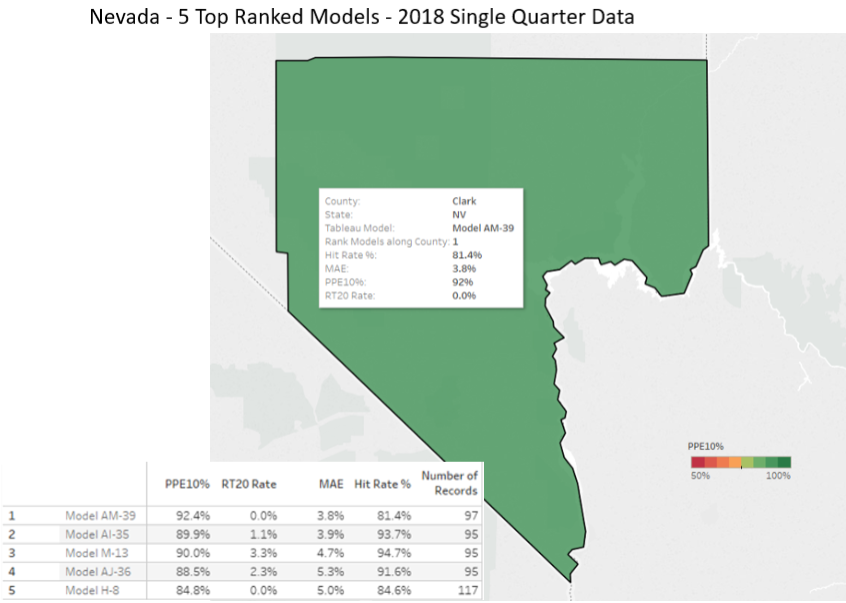
Figure 6 summarizes this exercise, which demonstrates the proper thinking when selecting models. First, focus on the market segment that you do business in – don’t use the model that performs best outside your service area. Second, rather than using a single model, you should use several models prioritized into what we call a “Model Preference Table®” in which models are ranked #1, #2, #3 for every segment of your market. Then, as you need to request an evaluation, the system should call the AVM in the #1 spot, and if it doesn’t get an answer, try the next model(s) if available.
In this way, you get the most competent model for the job. Even though one model will test better overall, it won’t be the best model everywhere and for every property type and price range. In our example, the #1 model in the nation was not the preferred model in every market segment we focused on. If we had focused on another geography or market segment, we almost certainly would have seen a reordering of the rankings and possibly even different models showing up in the top 5. The next quarter’s results might be different as well, because all the models’ developers are constantly recalibrating their algorithms; inputs and conditions are changing, and no one can afford to stand still.