In our menu above, under “AVM Information” we always have the latest version of our testing schedule. 2025 AVM Validation Testing Dates have been published there as of today.
#1 AVM in Each County Updated for Q3 2024
Every quarter we analyze all the top independently tested AVMs and compile the results. Click on this GIF to see the top AVM in each county for each quarter. As you watch the quarters change, you can see that the colors representing the top honors change frequently.
The main point is how frequently AVM performance changes. That should be no surprise, since market conditions change, and AVM’s have different strengths and tendencies. In Q3, AVMetrics independently tested 24 models; however, the GIF only highlights the 13 models that ranked in the top position of the MPTs. At least 11 AVMs shouldn’t be anyone’s first choice ANYWHERE, but they still have customers, presumably customers who don’t know the real performance of their AVMs. AVM Vendors and resellers are not Independent referees.
Independent testing is the only way to know how AVMs perform. This past quarter we saw several models retire while whole new models were introduced. Every model is constantly being improved as builders add new data feeds and use new techniques to get better results (with respect to new techniques, over at the AVMNews, we curate articles about AVMs, and we highlight several dozen new research articles about AVMs every year).
Q3 Change Highlights- Quarterly Trends Across the Coast
As ever, if you watch a part of the map, you’ll see several changes. But, in Q3, as markets stabilized at higher interest rate levels, we saw a changing of the guard. Here are some places to watch:
- In the Golden State, one of the highest priority counties in state has a new king, Los Angeles. Inyo, Imperial, King, and Tulare counties also changes hands (just to name a few).
- Several less-populated states had almost wholesale changes, such as the Dakotas, Alaksa, Montana, Wyoming, Nebraska, Oklahoma and Kansas.
- In the Sunshine State models were able to value several smaller counties that were not captured by models in Q2 including Collier, Columbia, Okeechobee, Suwannee, and Union.
Takeaways
Things change – a lot. Don’t rely on the results from last year or earlier this year. Heck, you can’t even trust last quarter! Often, 3 months’ of data are required to get a large enough sample in smaller regions, but we can slice it every way imaginable.
Use more than one AVM. It’s not obvious from a map showing just one AVM in each county, but if you think about what’s going on to produce these results, you’ll realize that AVMs have different strengths and there are a lot of them climbing all over each other to get to the top of the ranking. So, when you’re valuing a particular property, you just don’t know if it will be a good candidate for even the best AVM. When that AVM produces a result with low confidence, there’s a very good chance that another AVM will produce a reasonable estimate.
Use the right AVM for each use case and keep testing, because things change a lot and often.
Study: AVMetrics’ Predictive Testing Methodology
This content is restricted to subscribers
AVM Testing and Evaluation using AVM Performance Metrics
This content is restricted to subscribers
Principles for Calculating AVM Performance Metrics
This content is restricted to subscribers
Study: AVMetrics New Testing Methodology
This content is restricted to subscribers
AVMs React to New Final AVM Rules
On August 16th, Jon Wierks from First American penned an article about how First American is reacting to the new AVM Final Ruling. The article made several interesting points:
1. First American has specifically enhanced its AVM, their testing, and some of their tools in anticipation of the new rules. For example, FA has invested in explainable AI (xAI) in order to address fairness concerns.
Newer AVMs, like our Procision™ AVM Suite, were designed to comply with current AVM guidelines and in anticipation of the new guidelines.
2. First American expects AVM users to be expected to take on their own testing responsibility, and this doesn’t just apply to banks.
…new guidelines, Quality Control Standards for Automated Valuation Models, requires mortgage originators and secondary market issuers “to maintain policies, practices, procedures, and control systems to ensure that automated valuation models used in these transactions adhere to quality control standards
3. AEI’s recent AVM study has drawn attention to the biggest issues with AVM testing, and our new testing techniques are advancing testing beyond any other innovation in a decade.
For several years, AVMetrics has been developing a blind testing system that it will roll out later this year. Rather than sending the same addresses to various providers each month and getting back their valuations, AVM providers will now value every property in the U.S. — more than 100 million valuations each month — and send this data to AVMetrics. The testing company will ingest this data and then blind test it against future sales and listing prices as they transact. As you would expect, this is a massive undertaking for AVM vendors and AVMetrics, but it will separate the AVMs that test well from those that actually perform well in real-world conditions.
Wierks’ conclusions are right on target with our beliefs that improving AVM accuracy, precision and confidence scoring are making them more useful to industry, and that appropriate testing is a prerequisite to their widespread adoption.
#1 AVM in Each County Updated for Q2 2024
Every quarter we analyze all the top AVMs and compile the results. Click on this GIF to see the top AVM in each county for each quarter. As you watch the quarters change, you can see that the colors representing the top honors change frequently.
The main point is how frequently AVM performance changes. That should be no surprise, since market conditions change and AVM’s have different strengths and tendencies. Phoenix has more tract housing, and some AVMs are optimized for that. Cities in the northeast have more row housing, and some models are better there. But AVMs also change – a lot. Whole new models are introduced, but every model is constantly being improved as builders add new data feeds and use new techniques to get better results (with respect to new techniques, over at the AVMNews, we curate articles about AVMs, and we highlight several hundred new research articles about AVMs every year).
Q2 Change Highlights
As ever, if you watch a part of the map, you’ll see several changes. In Q2, we saw a changing of the guard. Here are some places to watch:
- In Texas, most counties changed leadership. The counties that include Austin and its suburbs changed leadership. Not Dallas, but most of the counties around Dallas, and not Houston (Harris), but most of the counties around Harris County changed leadership.
- Much of Alaska, and the West Coast changed leadership.
- Some less-populated areas had almost wholesale changes, such as Colorado, Nevada, New Mexico, the Dakotas, rural Michigan, Illinois, Missouris, Arkansas, Louisiana, Mississippi and more.
Takeaways
- Things change – a lot. Don’t rely on the results from last year. Heck, you can’t even trust last quarter! We compile these results quarterly, but our testing is non-stop, and we can produce new optimizations monthly based on a rolling 3 months or any other time period. Often, 3 months’ of data are required to get a large enough sample in smaller regions, but we can slice it every way imaginable.
- Use more than one AVM. It’s not obvious from a map showing just one AVM in each county, but if you think about what’s going on to produce these results, you’ll realize that AVMs are climbing all over each other to get to the top of the ranking. So, when you’re valuing a particular property, you just don’t know if it will be a good candidate for even the best AVM. When that AVM produces a result with low confidence, there’s a very good chance that another AVM will produce a reasonable estimate. Why not be able to take three, four or five bites at the apple?
Introducing PTM™ – Revolutionizing AVM Testing for Accurate Property Valuations
When it comes to residential property valuation, Automated Valuation Models (AVMs) have a lurking problem. AVM testing is broken and has been for some time, which means that we don’t really know how much we can or should rely on AVMs for accurate valuations.
Testing AVMs seems straightforward: take the AVM’s estimate and compare it to an arm’s length market transaction. The approach is theoretically sound and widely agreed upon but unfortunately no longer possible.
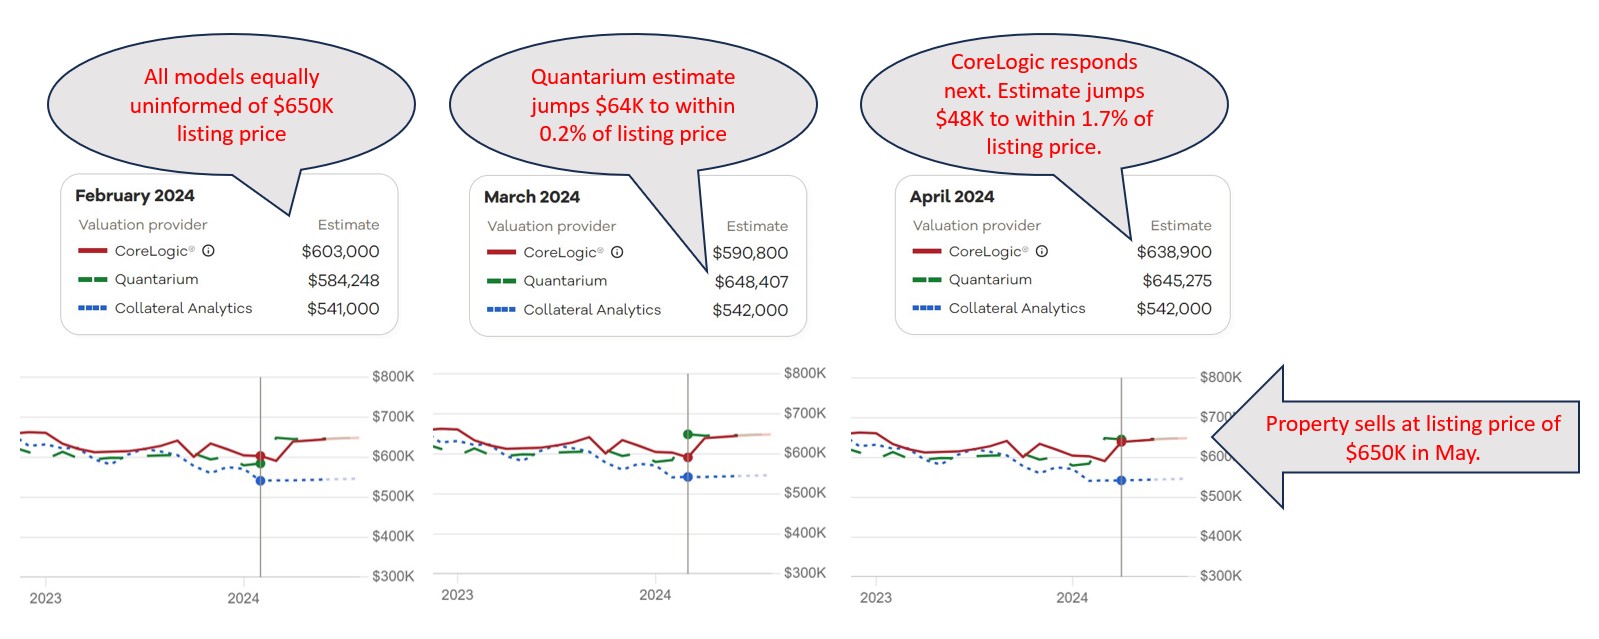
Once you see the problem, you cannot unsee it. The issue lies in the fact that most, if not all, AVMs have access to multiple listing data, including property listing prices. Studies have shown that many AVMs anchor their predictions to these listing prices. While this makes them more accurate when they have listing data, it casts serious doubt on their ability to accurately assess property values in the absence of that information.
All this opens up the question: what do we want to use AVMs for? If all we want is to get a good estimate of what price a sale will close at, once we know the listing price, then they are great. However, if the idea is to get an objective estimate of the property’s likely market value to refinance a mortgage or to calculate equity or to measure default risk, then they are… well, it’s hard to say. Current testing methodology can’t determine how accurate they are.
But there is promise on the horizon. After five years of meticulous development and collaboration with vendors/models, AVMetrics is proud to unveil our game-changing Predictive Testing Methodology (PTM™), designed specifically to circumvent the problem that is invalidating all current testing. AVMetrics’ new approach will replace the current methods cluttering the landscape and finally provide a realistic view of AVMs’ predictive capabilities.1
At the heart of PTM™ lies our extensive Model Repository Database (MRD™), housing predictions from every participating AVM for every residential property in the United States – an astonishing 100 to 120 million properties per AVM. With monthly refreshes, this database houses more than a billion records per model and thereby offers unparalleled insights into AVM performance over time.
But tracking historical estimates at massive scale wasn’t enough. To address the influence of listing prices on AVM predictions, we’ve integrated a national MLS database into our methodology. By pinpointing the moment when AVMs gained visibility into listing prices, we can assess predictions for sold properties just before this information influenced the models, which is the key to isolating confirmation bias. While the concept may seem straightforward, the execution is anything but. PTM™ navigates a complex web of factors to ensure a level playing field for all models involved, setting a new standard for AVM testing.
So, how do we restore confidence in AVMs? With PTM™, we’re enabling accurate AVM testing, which in turn paves the way for more accurate property valuations. Those, in turn, empower stakeholders to make informed decisions with confidence. Join us in revolutionizing AVM testing and moving into the future of improved property valuation accuracy. Together, we can unlock new possibilities and drive meaningful change in the industry.
1The majority of the commercially available AVMs support this testing methodology, and there is over two solid years of testing that has been conducted for over 25 models.
Feds to Lenders: Take AVMs Seriously
Regulators are signaling that they are going to be looking at how AVMs are used and whether lenders have appropriately tested them and continuously monitor them for valuation discrimination. This represents a change in the focus on AVMs and the need for all lenders to focus on AVM validation to avoid unfavorable attention from government regulators.
On Feb 12, the FFIEC issued a statement on examinations from regulators. It specifically stated that it didn’t represent a change in principles, nor a change in guidance, and not even a change in focus. It was just a friendly announcement about the exam process, which will focus on whether institutions can identify and mitigate bias in residential property valuations.
Law firm Husch Blackwell published their interpretation a week later. Their analysis included consideration of the June 2023 FFIEC statement on the proposed AVM quality control rule, which would include bias as a “fifth factor” when evaluating AVMs. They interpret these different announcements as part of a theme, an extended signal to the industry that all valuations, and AVMs in particular, are going to receive additional scrutiny. Whether that is because bias is as important as quality or because being unbiased is an inherent aspect of quality, the subject of bias is drawing attention, but the result will be a thorough examination of all practices around valuation, including AVMs, from oversight to validation, training, auditing, etc.
AVM quality has theoretically been an issue that could be enforced by regulators in some circumstances for over a decade. What we’re seeing is not just an expansion from accuracy into questions of bias. We’re also seeing an expansion from banks into all lenders, including non-bank lenders. And, they are signaling that examinations will focus on bias, which is an expansion from the theoretical requirement to an actual, manifest, serious requirement.