Judgment, Independence, and the Role of Testing in a Black-Box World
The Appraisal Standards Board’s proposed Advisory Opinion 41 (AO-41), Use of Technology in an Appraisal or Appraisal Review Assignment, has generated thoughtful—and in some cases pointed—discussion across the appraisal and collateral-risk communities. Much of that discussion centers on what AO-41 does not do: it does not define “technology,” it does not distinguish sharply between process tools and product tools, and it does not resolve long-standing tensions in USPAP between established practice and emerging methods. Those critiques are valid. But they also risk missing what AO-41 is really trying to accomplish. In our view, AO-41 is not about endorsing new technology, nor is it about forcing appraisers to become data scientists or software engineers. It is about how appraisers demonstrate professional judgment and competency when technology—especially opaque, third-party technology—becomes unavoidable. That problem is not new. What is new is its scale.
We’ve Seen This Movie Before
Many appraisers will recognize the pattern. When multiple regression analysis (MRA) entered mainstream appraisal education, it was often presented as a way to produce mathematically precise, “market-supported” adjustments. In practice, MRA worked well in some markets and poorly in others. The issue was not regression itself—it was that appraisers were encouraged to use it without sufficient conceptual grounding in when its results were meaningful and when they were not. The result was often false confidence rather than better judgment. AO-41 reflects a similar inflection point—this time driven by AVMs, machine learning, computer vision, and generative AI. The tools are more powerful, more opaque, and far more client-driven than before. But the professional obligation has not changed: only the appraiser produces assignment results.
AVMs, AI, and the Accountability Gap
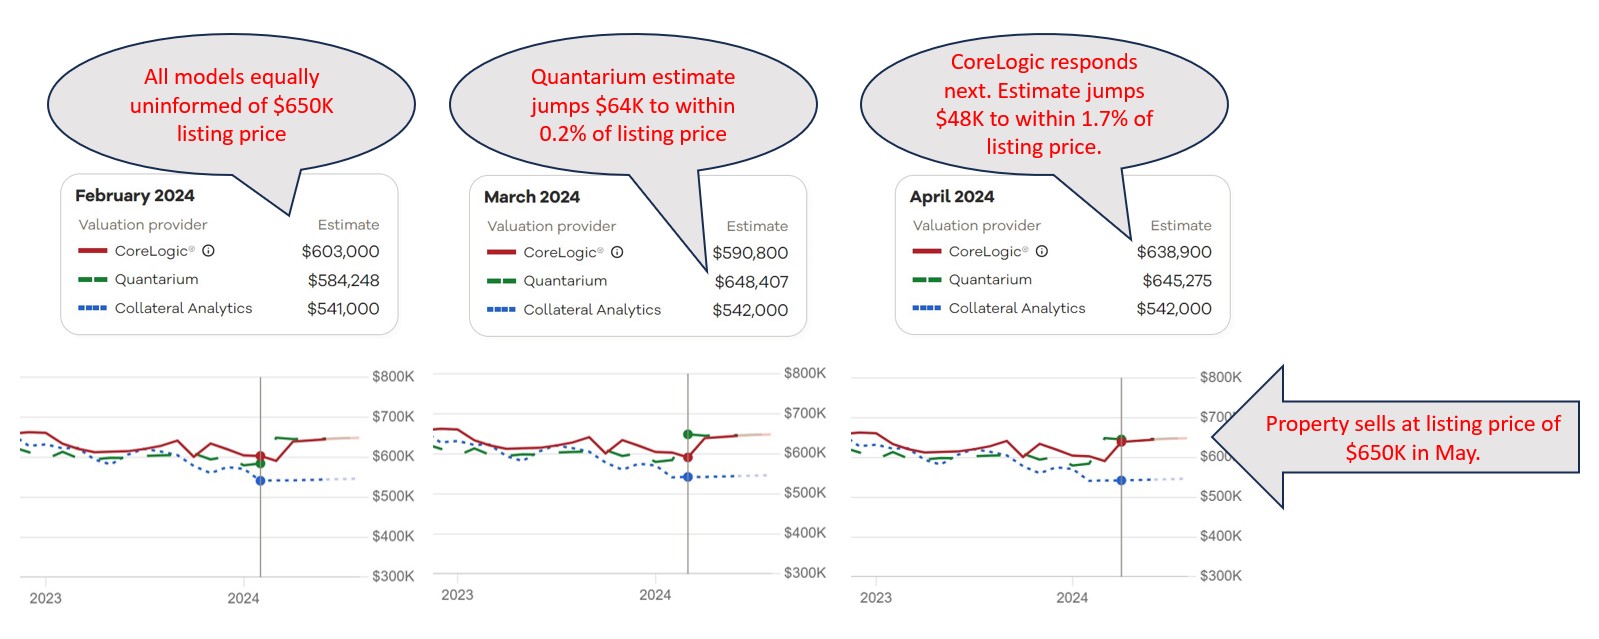
One criticism raised in recent commentary is that AVMs are not subject to USPAP, are not transparent, and operate based on lender-defined scope and inputs. All of that is true. But it is precisely why AO-41 exists. AO-41 does not attempt to pull AVMs under USPAP. Instead, it forces an uncomfortable but necessary question: What does competent reliance look like when the mechanics of the tool are outside the appraiser’s control? AO-41 answers that question indirectly. It makes clear that appraisers are not required to understand or replicate algorithms—but they are required to understand enough to evaluate relevance, limitations, and credibility for the intended use. That is a judgment problem, not a coding problem.
Independent Testing as a Competency Enabler
This is where the industry conversation needs to mature. For opaque tools, competency cannot reasonably come from inside the model. It must come from external, objective evidence of how the tool behaves. Independent, third-party testing—conducted outside the appraisal assignment—can provide exactly that context:
* historical accuracy and dispersion,
* stability across markets, price tiers, and property types,
* known limitations or failure modes, and
* awareness of differential performance that may raise fair housing concerns.
Importantly, independent testing does not replace appraisal analysis or judgment. It produces informational evidence, not assignment results. It helps appraisers answer a practical AO-41 question: Is reliance on this tool reasonable here, or should it be limited—or avoided altogether? Or as is our motto here at AVMetrics… “The best thing an AVM can tell you is when NOT to use it”
This framing is fully consistent with AO-41’s core principles and with the Interagency AVM Quality Control Standards, which emphasize ongoing monitoring of AVM accuracy, reliability, and potential bias. Appraisers are not being asked to perform fair lending analysis—but awareness of model behavior across market segments is now inseparable from credibility.
Education, Not Enforcement
Another concern raised in recent commentary is that AO-41 risks merging new tools into old expectations and legacy education. That concern is well taken. In our opinion, USPAP has always struggled to balance encouragement of new methods with deference to established practice. The path forward is not more prescriptive rules. It is better education and clearer boundaries. Appraisers do not need to know how an AVM or AI model works internally. But they should be able to explain, in plain language:
* why a tool was appropriate (or not) for a specific assignment,
* how its output was evaluated for reasonableness, and
* why reliance was full, limited, or declined.
If that explanation cannot be made clearly—“to a sixth grader,” as one educator recently put it—then reliance probably wasn’t appropriate.
What AO-41 Is Really Signaling
AO-41 is not a referendum on technology. It is a signal that the profession needs:
* clearer educational pathways,
* shared reference points for evaluating opaque tools, and
* realistic expectations about what appraisers are—and are not—being asked to understand.
If the exposure process leads to broader recognition that independent testing and education are necessary supports for professional judgment—not substitutes for it—then AO-41 will have served a useful purpose, even as its language continues to evolve. That conversation is exactly what the exposure draft process is meant to surface. And it is one the appraisal and collateral-risk communities should continue—carefully, constructively, and with judgment front and center.