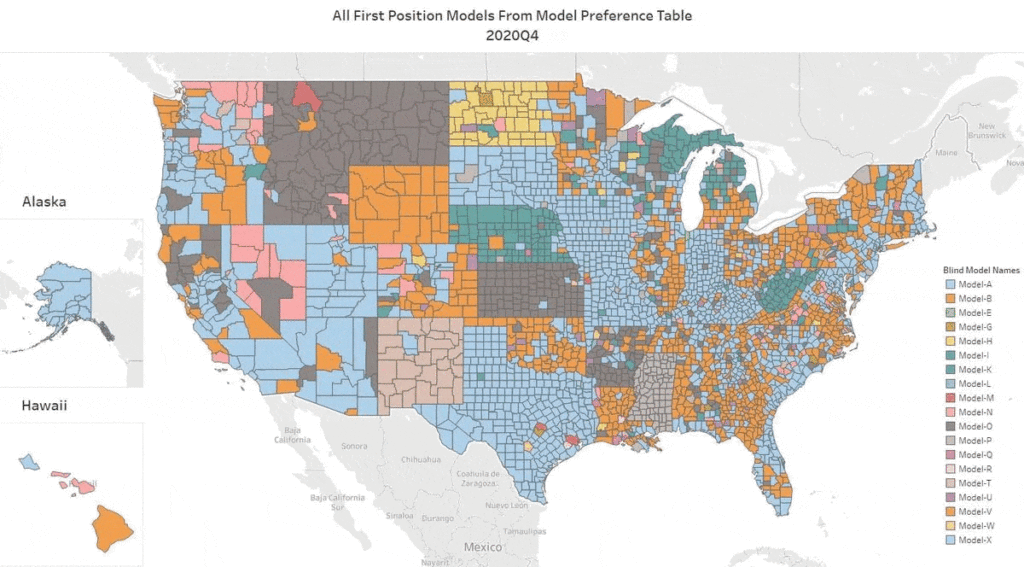
We’ve got the update for Q3 2022. Our top AVM GIF shows the #1 AVM in each county going back 8 quarters. This graphic demonstrates why we never recommend using a single AVM. Again, there are 19 AVMs in the most recent quarter that are “tops” in at least one county!
The expert approach is to use a Model Preference Table® to identify the best AVM in each region. (Actually, our MPT® typically identifies the top 3 AVMs in each county.) Or, you could use a cascade to tap into the best AVM for whatever your application.
This time, the Seattle area and the Los Angeles region stayed light blue, just like the previous quarter. But, most of the populous counties in Northern California changed hands. Sacramento was the exception, but Santa Clara, Alameda, Contra Costa, San Mateo and some smaller counties like Calaveras (which means “skulls”) changed sweaters. Together they account for 6 million northern Californians who just got a new champion AVM.
A number of rural states changed hands almost completely… again. New Mexico, Wyoming, North Dakota, South Dakota, Montana and Nebraska as well as Arkansas, Mississippi, Alabama and rural Georgia crowned different champions for most counties. I could go on.
All that goes to show the importance of using multiple AVMs and getting intelligence on how accurate and precise each AVM is.
